Plots
One of the best things about Python’s data science ecosystem is the richness of its visualization libraries, and Pyodios makes that just as seamless on iOS. Any time your Python code generates a graphic, whether from the Console, the Editor, or a Notebook, the app automatically captures it and saves it to the Plots gallery. You do not need to do anything special; just write plotting code the way you normally would.
Static Plots
Whenever you run Python code that produces a matplotlib figure, the app intercepts the output and renders it as a native image. This works with matplotlib and any library built on top of it, such as seaborn:
import matplotlib.pyplot as plt
import numpy as np

fig, axes = plt.subplots(1, 2, figsize=(10, 4))
x = np.linspace(0, 10, 100)
axes[0].plot(x, np.sin(x), 'b-', linewidth=2)
axes[0].set_title("Sine Wave")
axes[1].hist(np.random.randn(500), bins=30, color='steelblue')
axes[1].set_title("Normal Distribution")
plt.tight_layout()
plt.show()
You do not need to call plt.savefig() or save anything manually. The app handles all of that behind the scenes. Just run your code and flip over to the Plots tab to see the result.
Static plots support pinch to zoom so you can inspect fine details, labels, and data points up close.


Interactive Plots
Pyodios also supports interactive plotting libraries that render as web views with full interactivity:
- Plotly: hover to see data values, zoom into regions, pan across the plot, and toggle series visibility
- Bokeh: interactive charts with linked brushing and hover tooltips
- Altair: declarative statistical visualizations with interactive selections
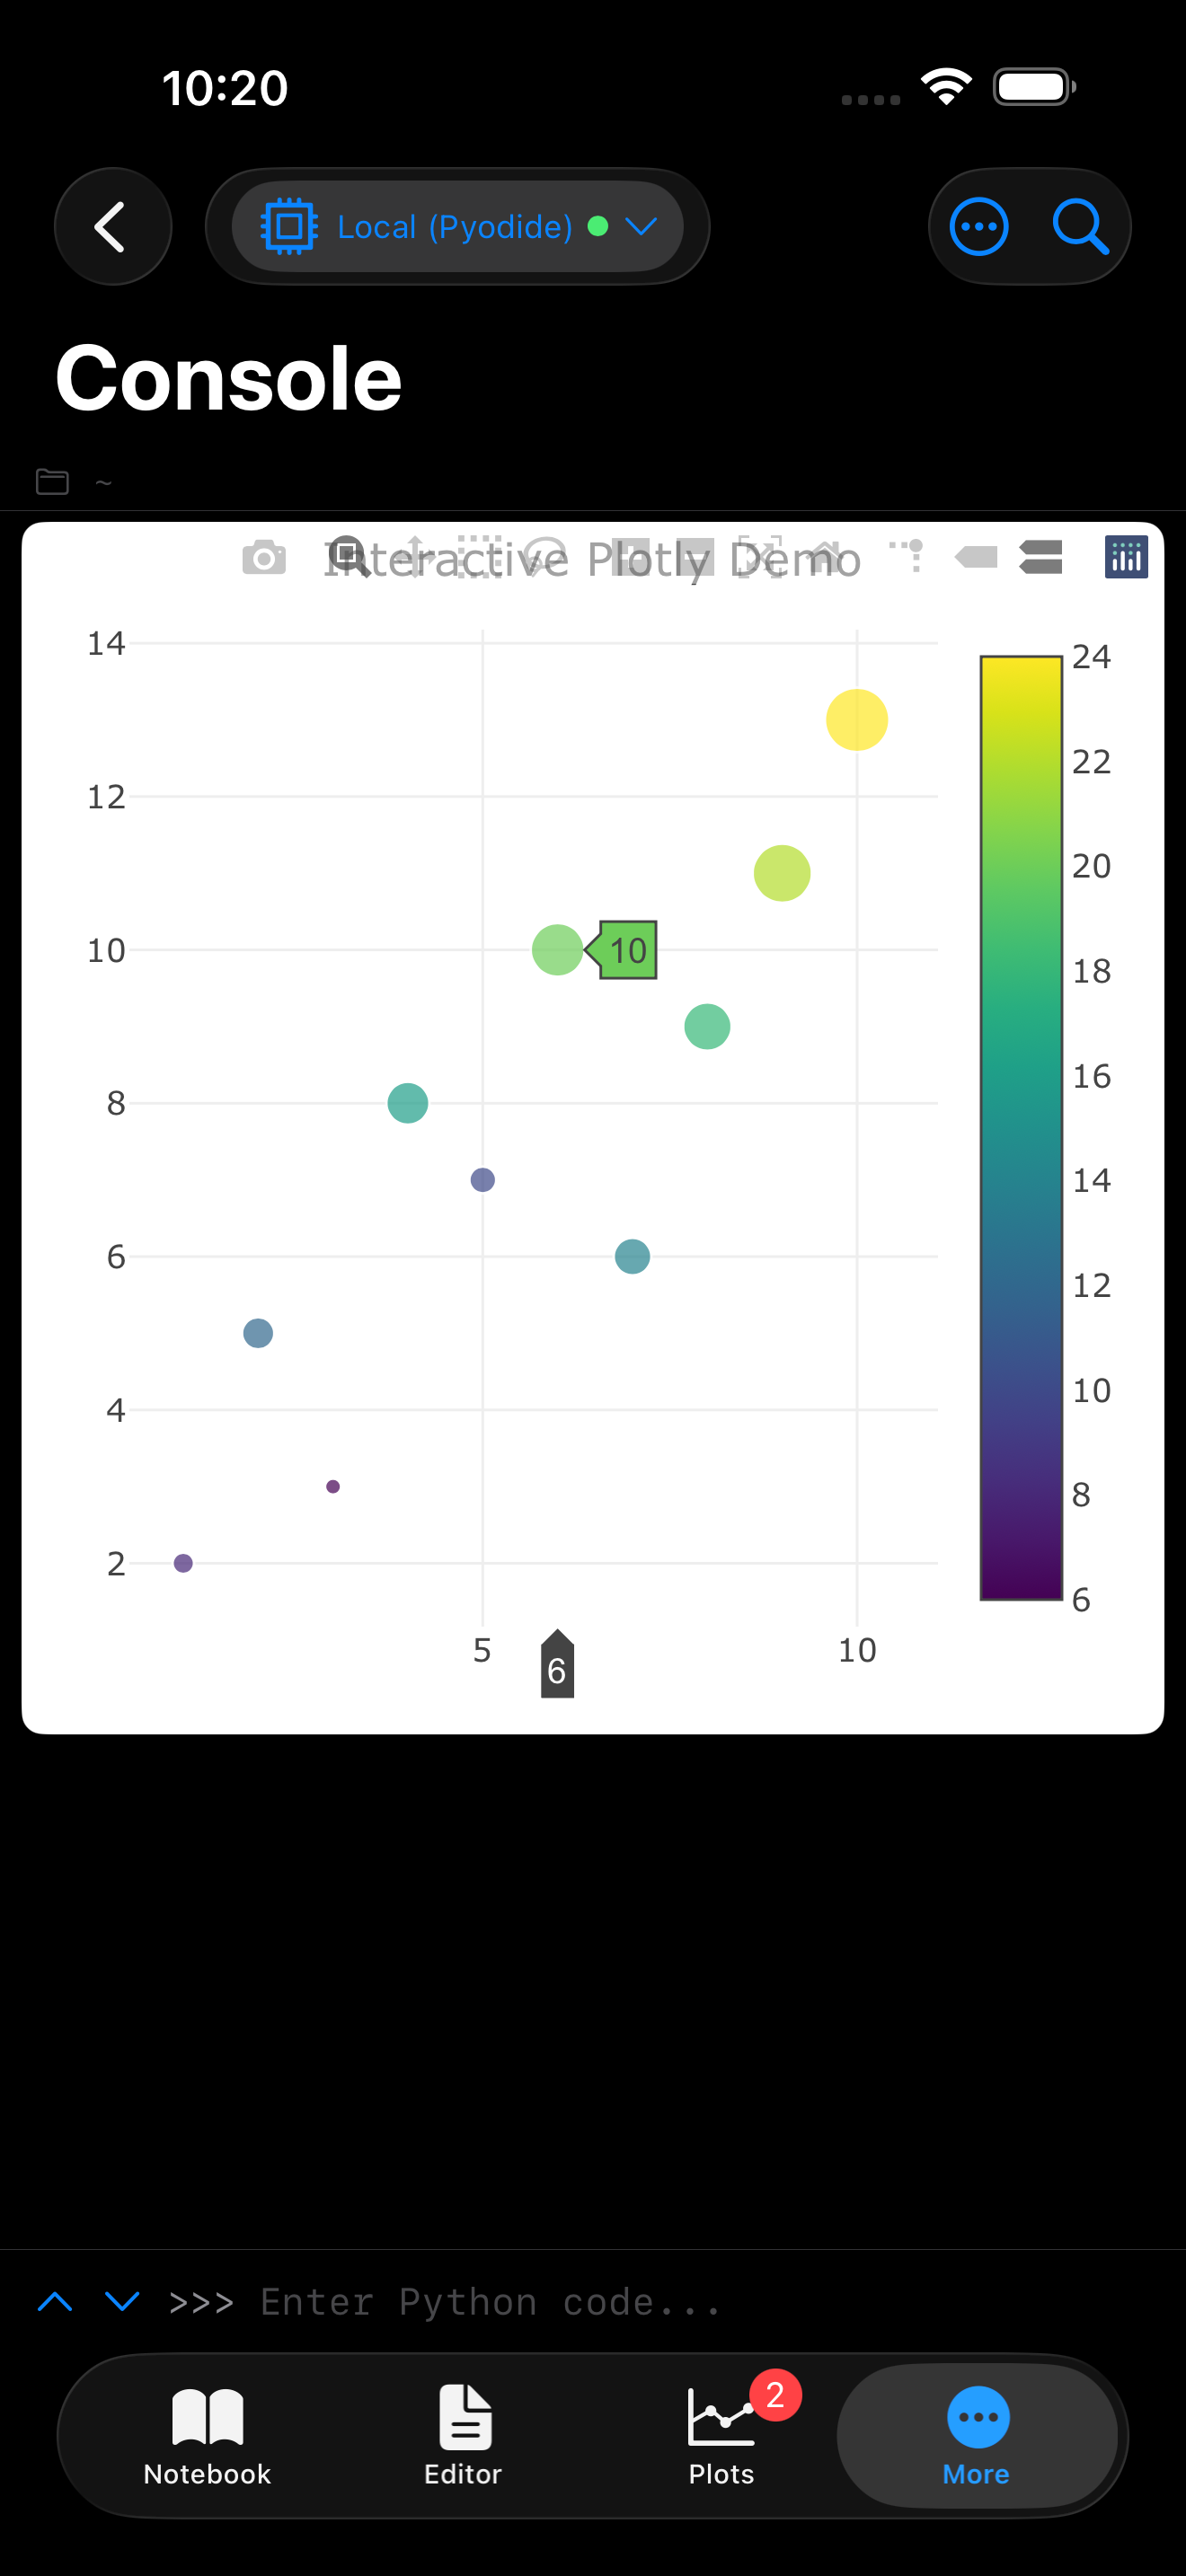
Interactive plots render inline in the Console or Editor output tray via a built-in web view, so you get zoom, pan, and hover behavior right where you ran the code.
import plotly.express as px
import numpy as np

df = px.data.iris()
fig = px.scatter(df, x="sepal_width", y="sepal_length",
                 color="species", size="petal_length",
                 title="Iris Dataset")
fig.show()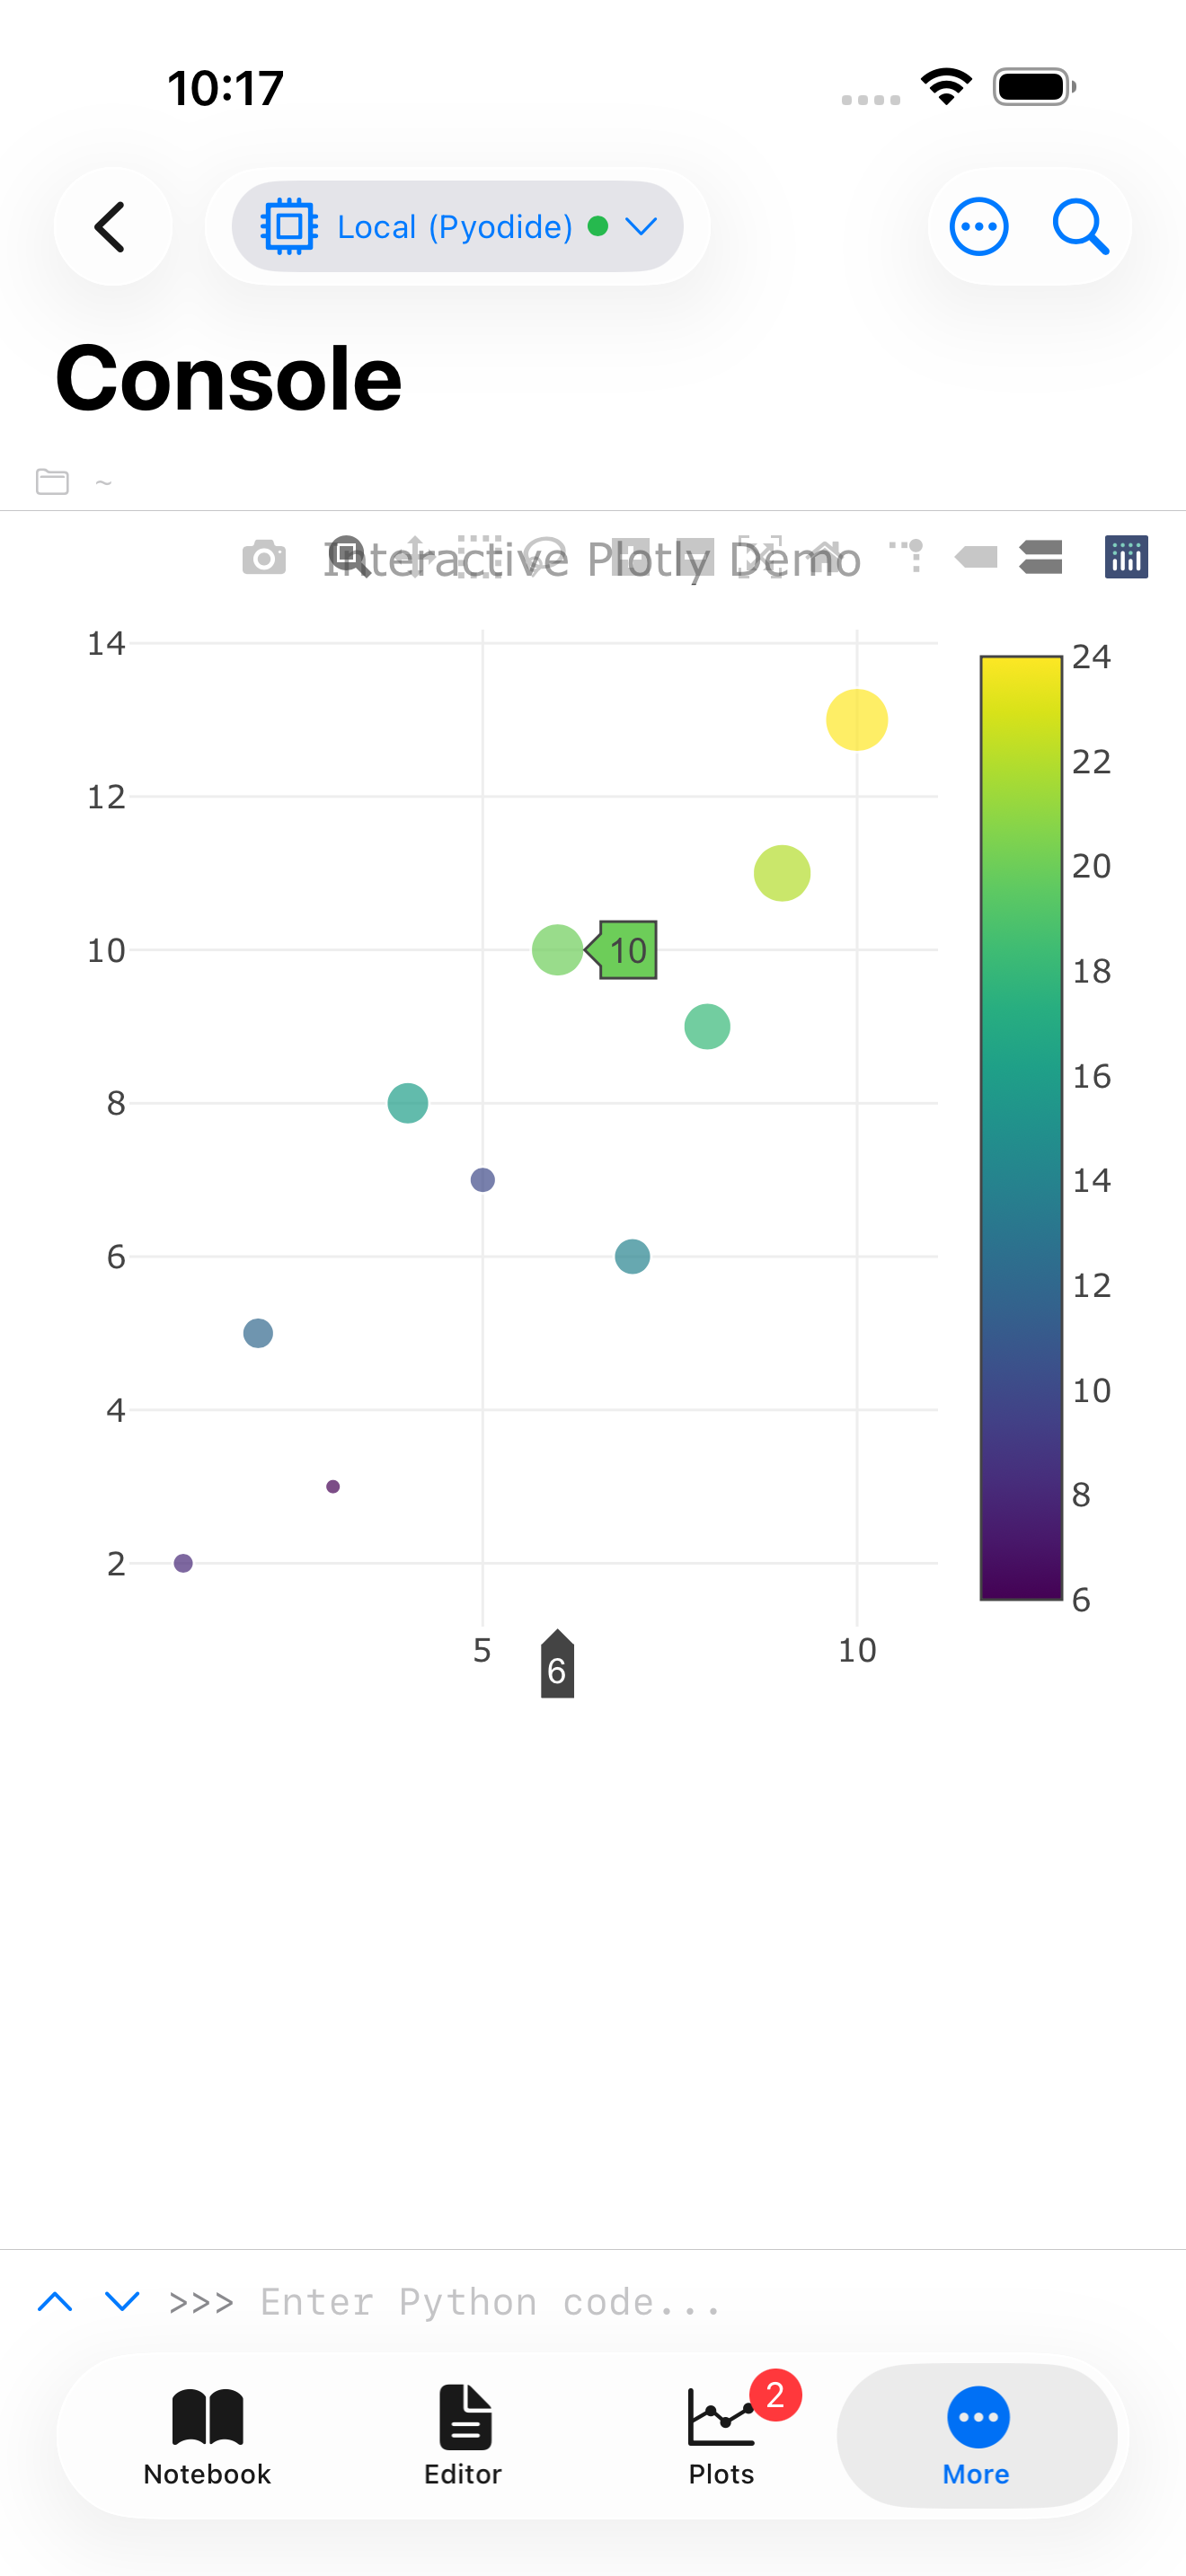
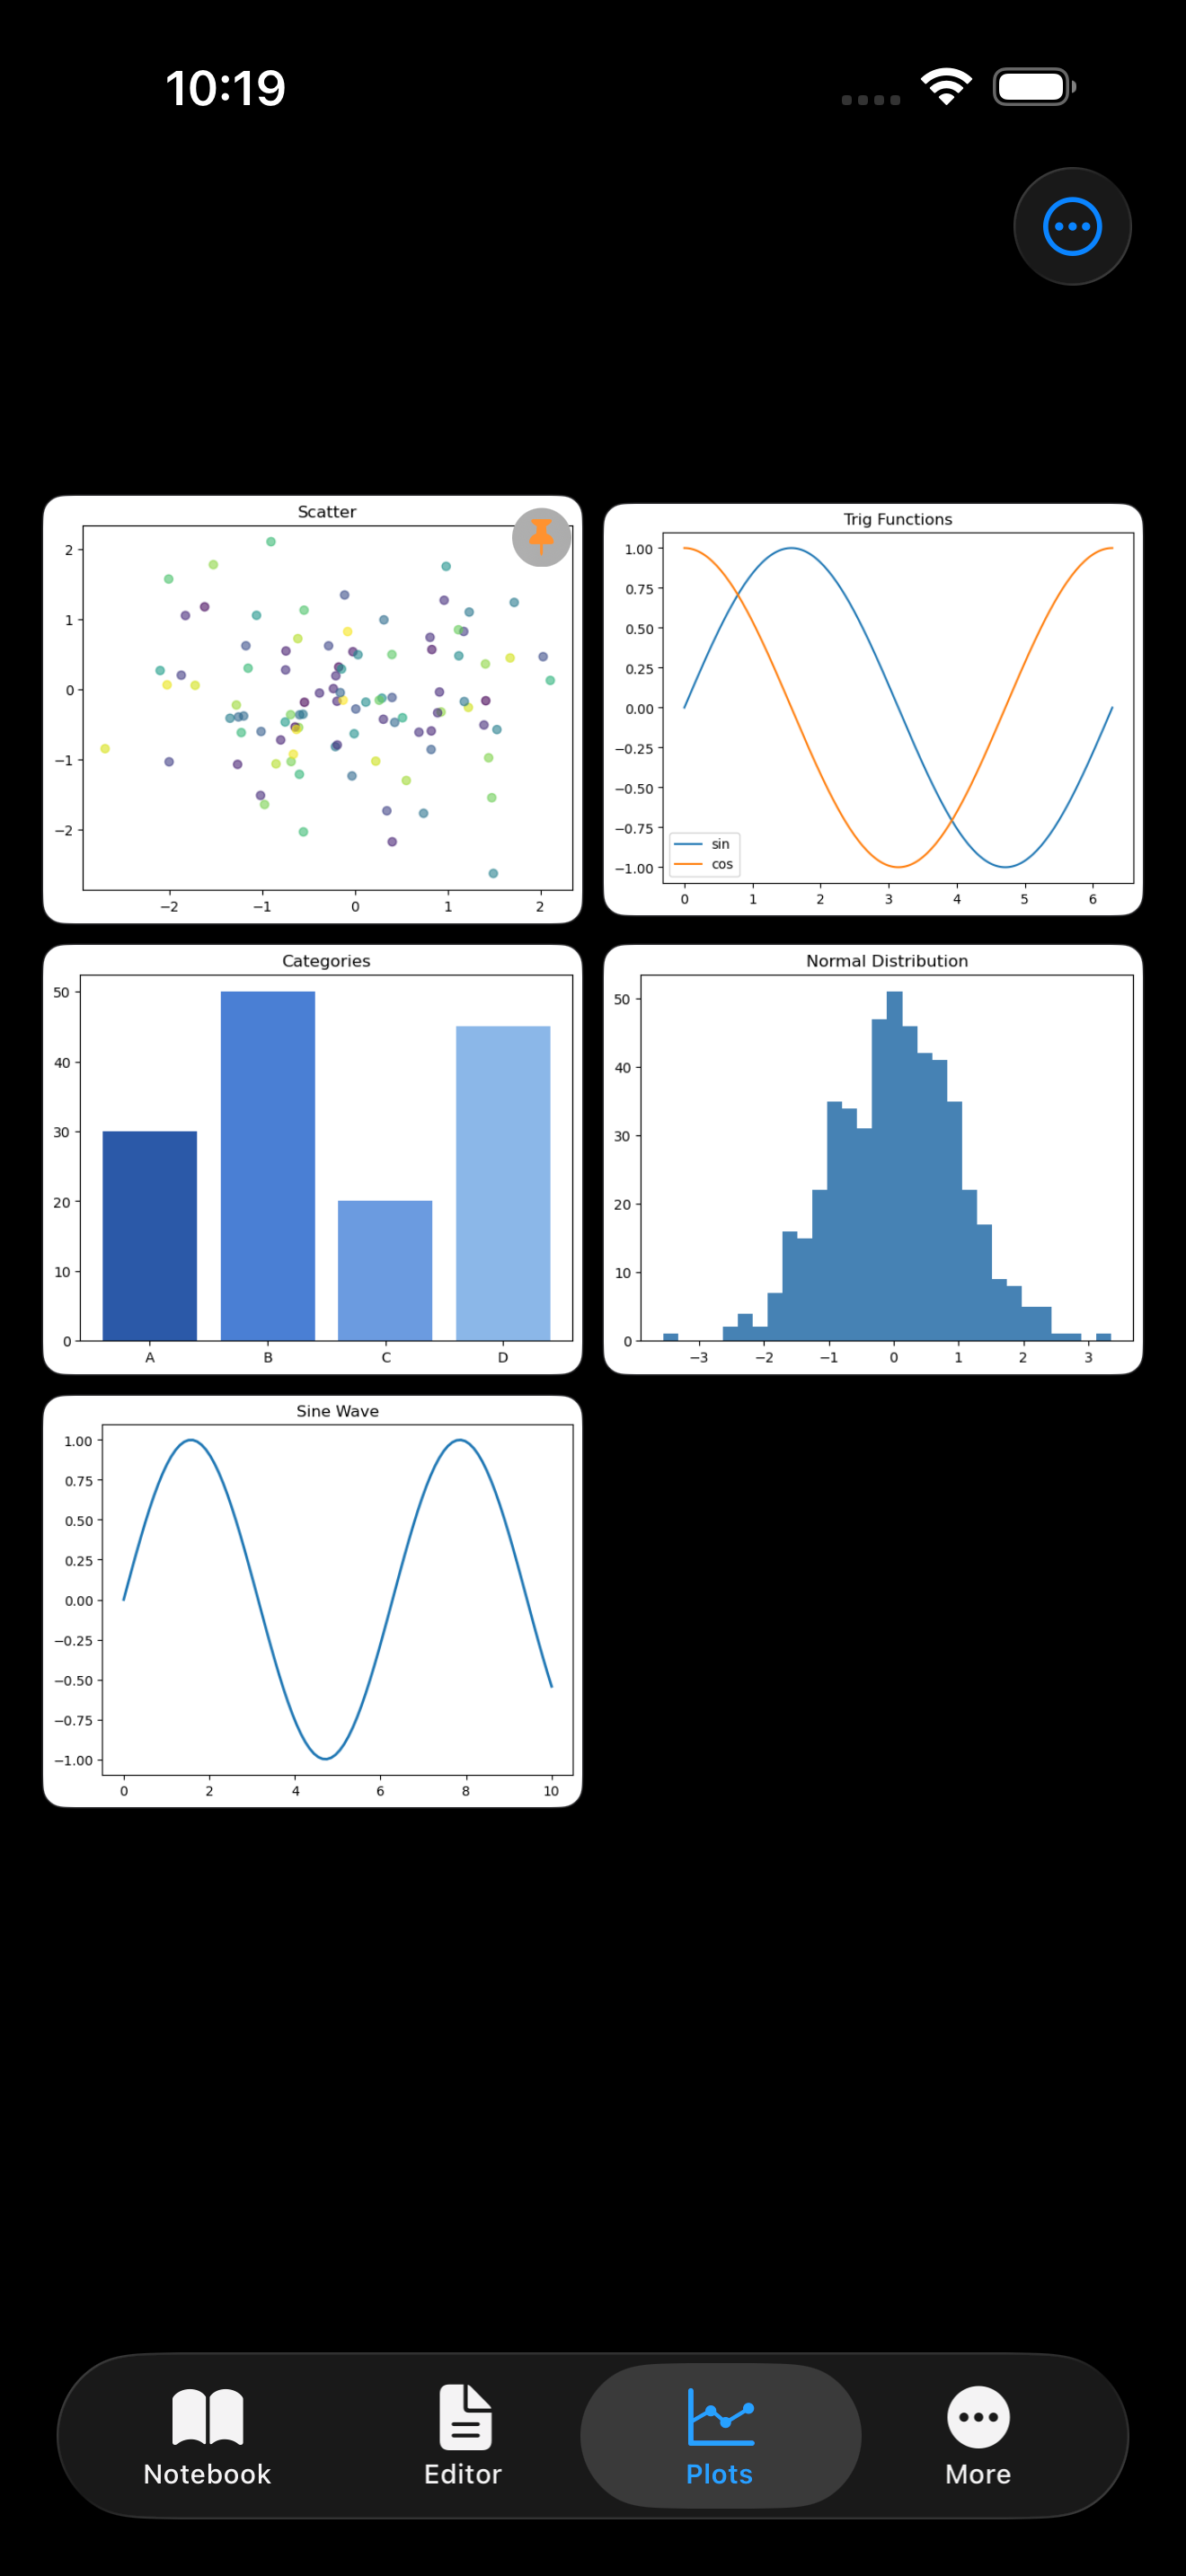
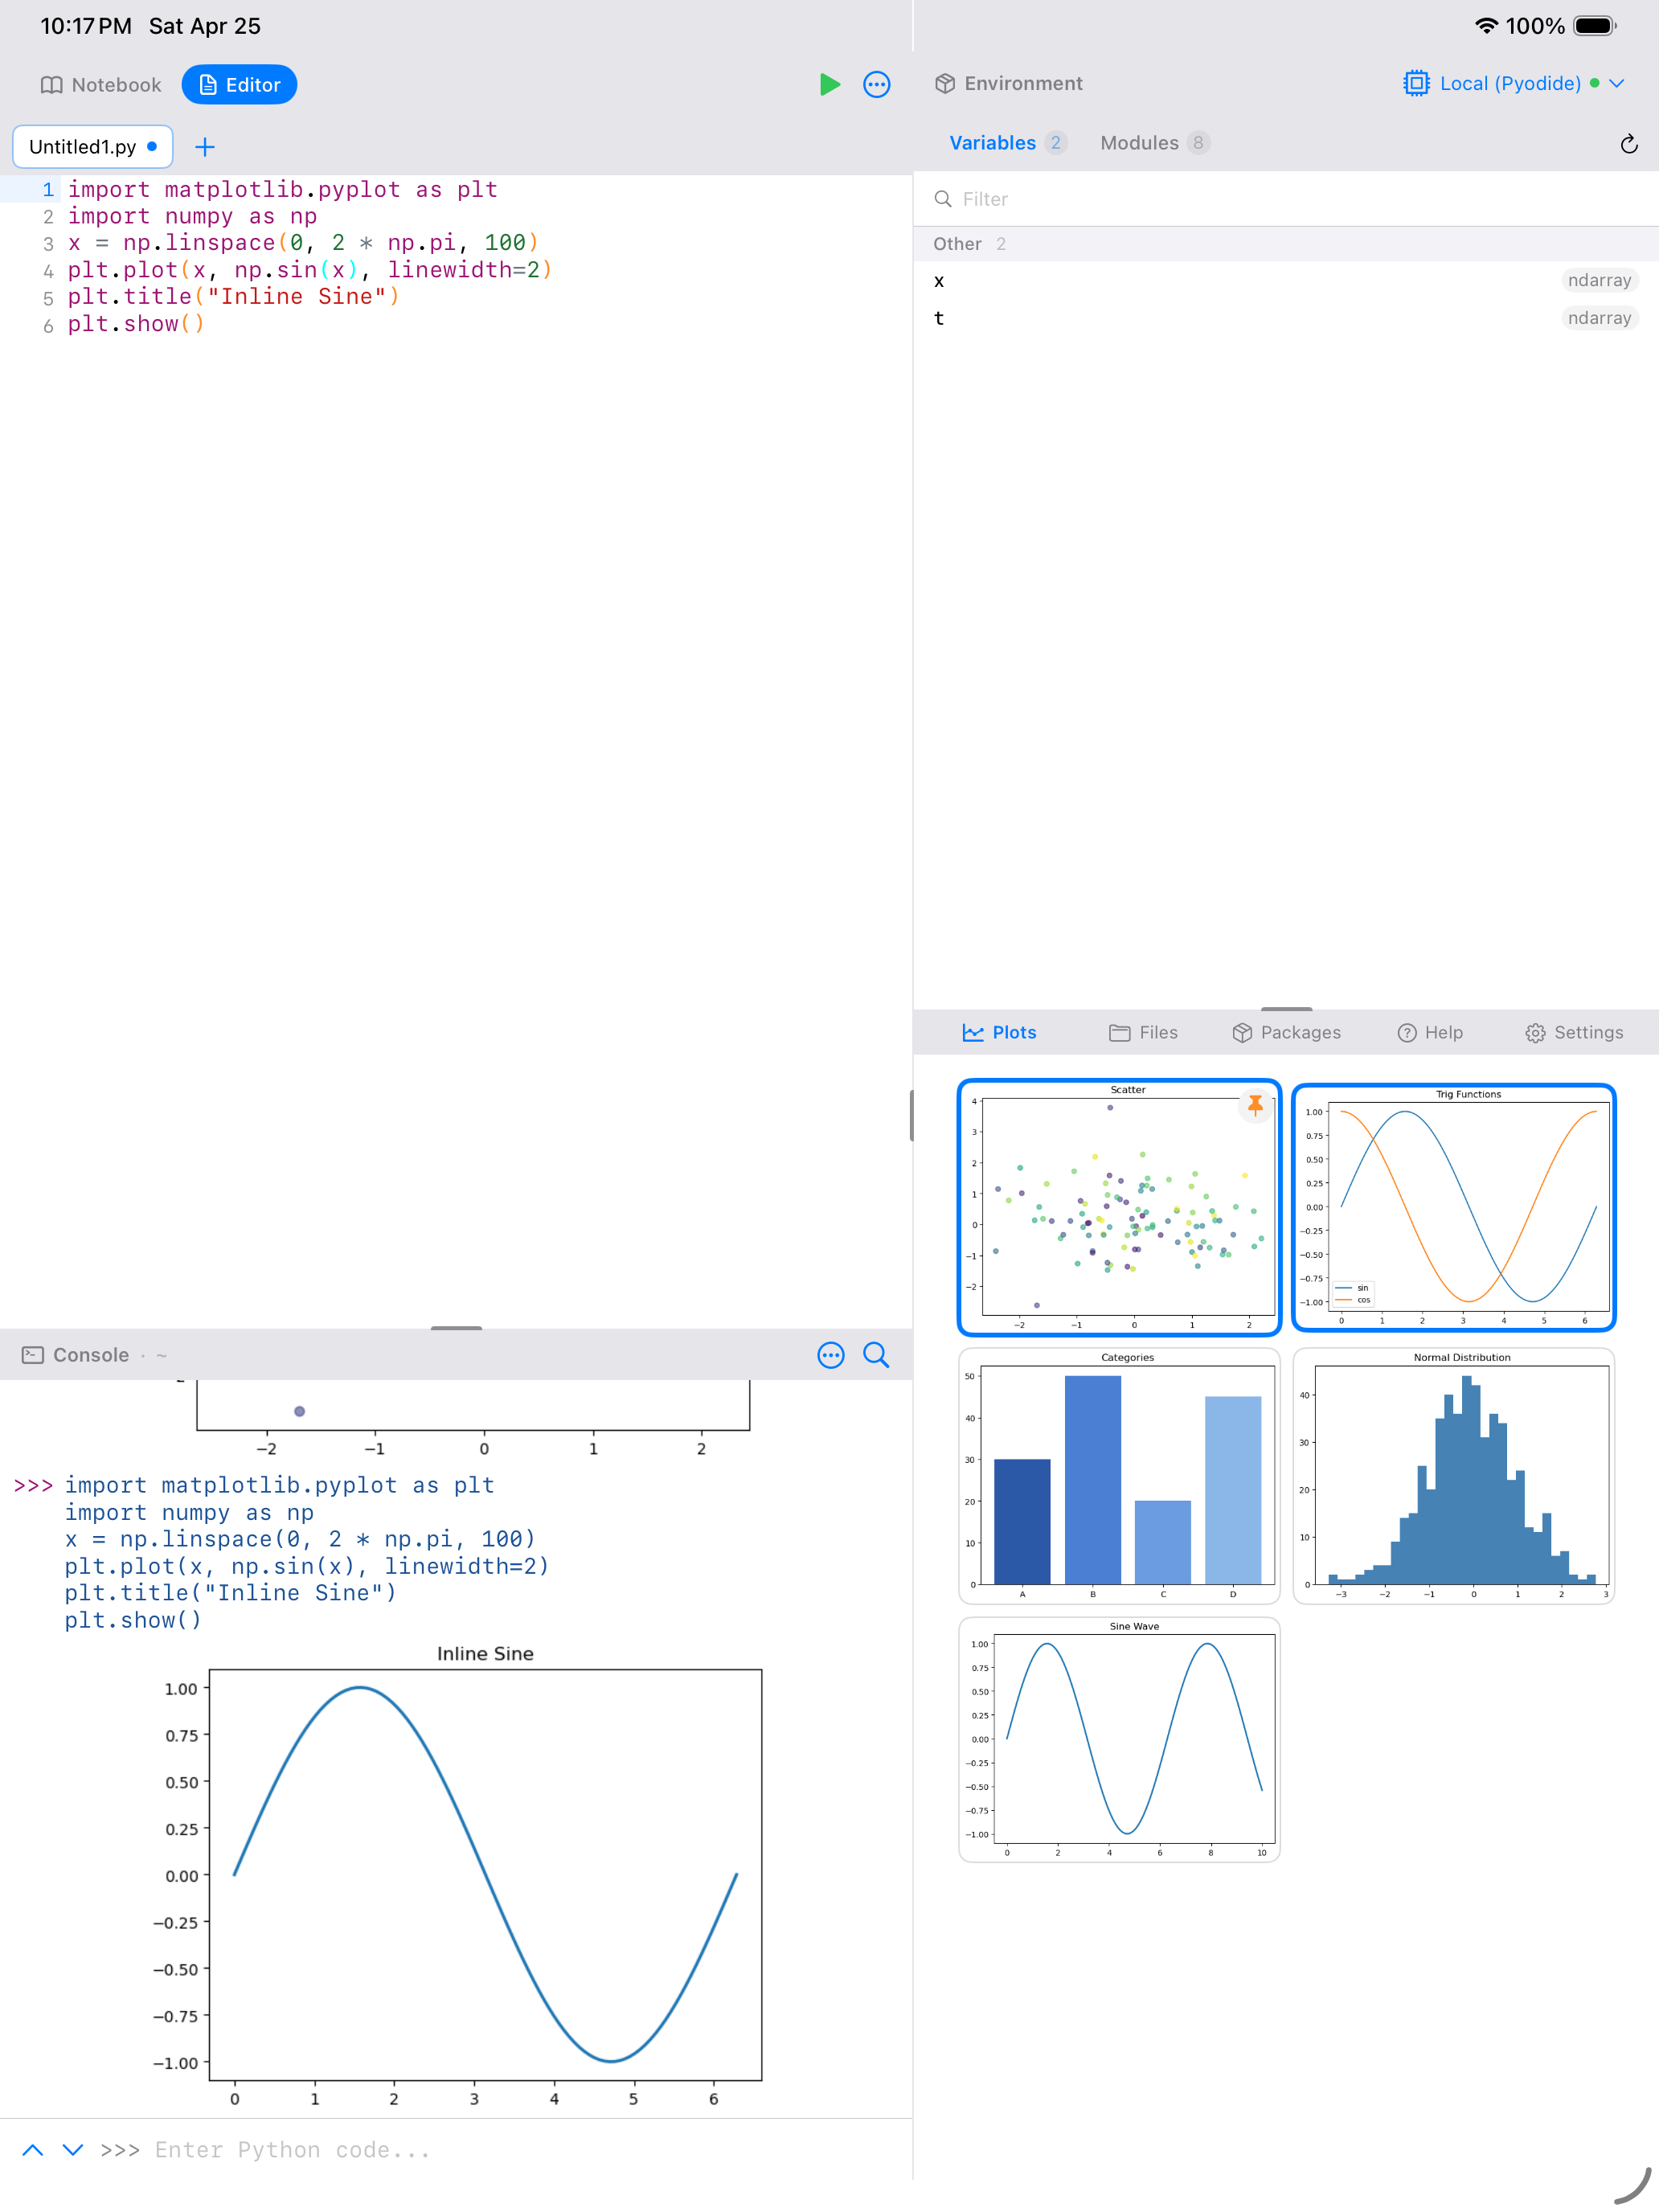
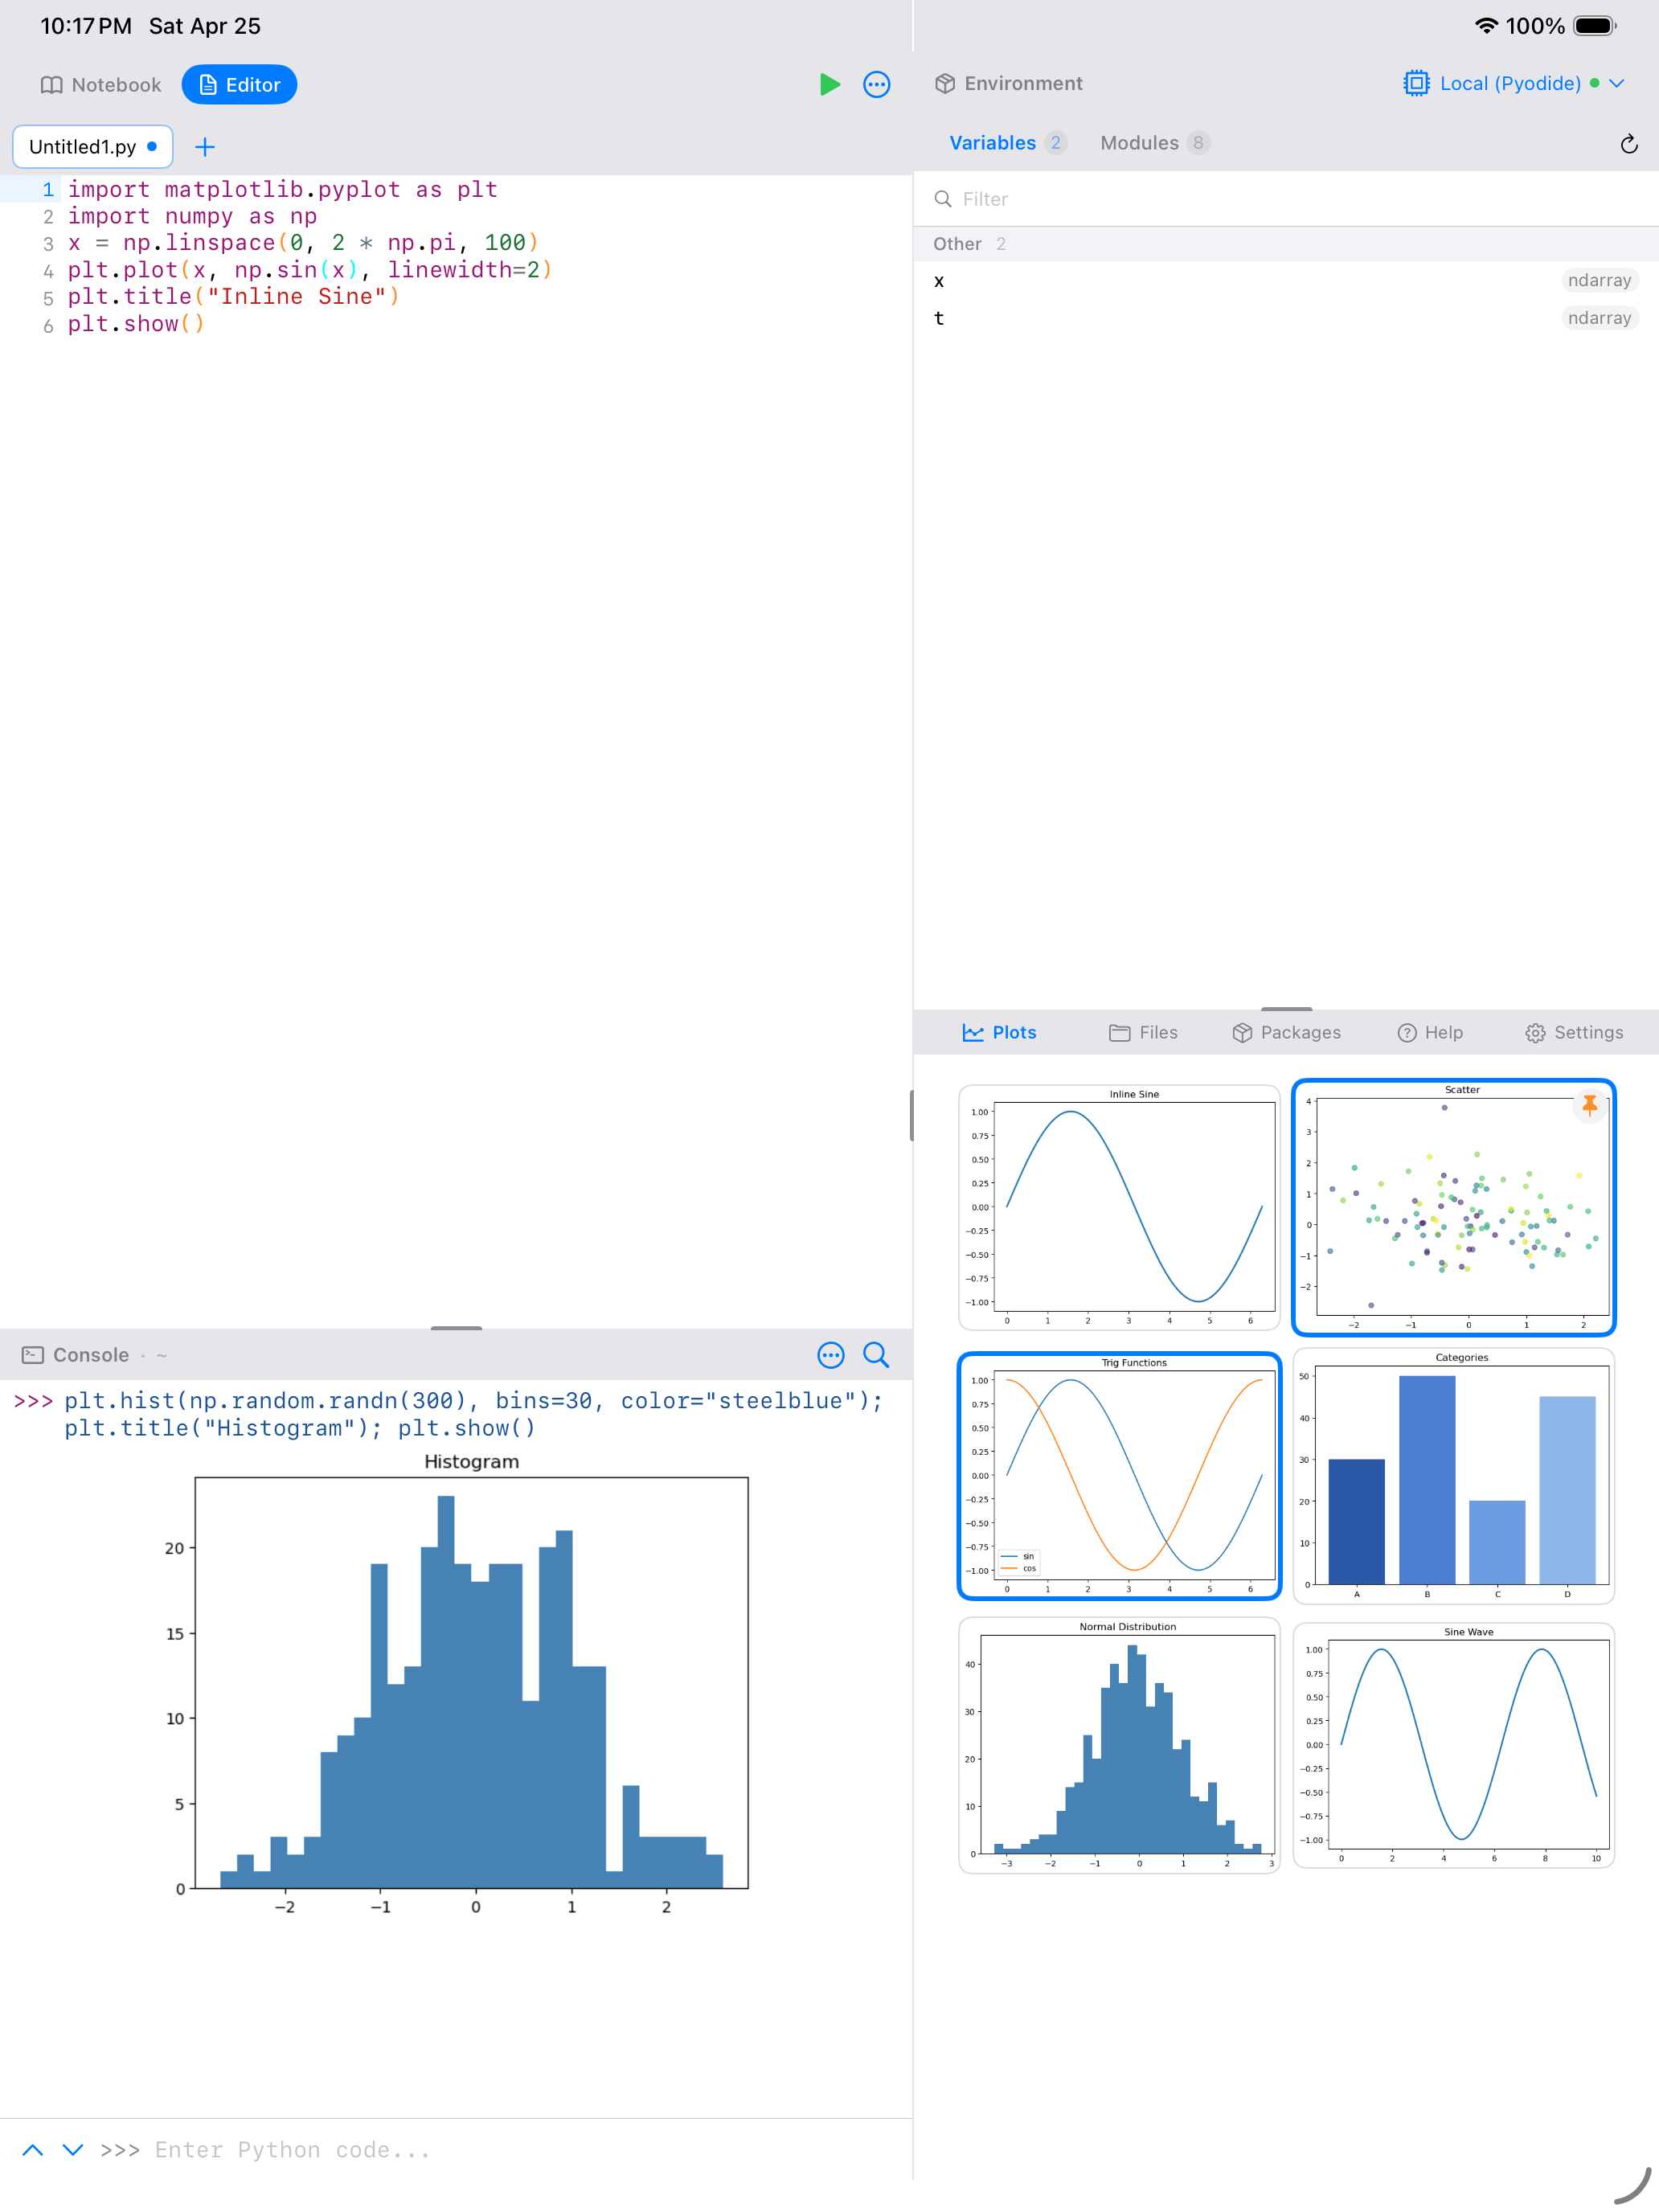
The Plot Gallery
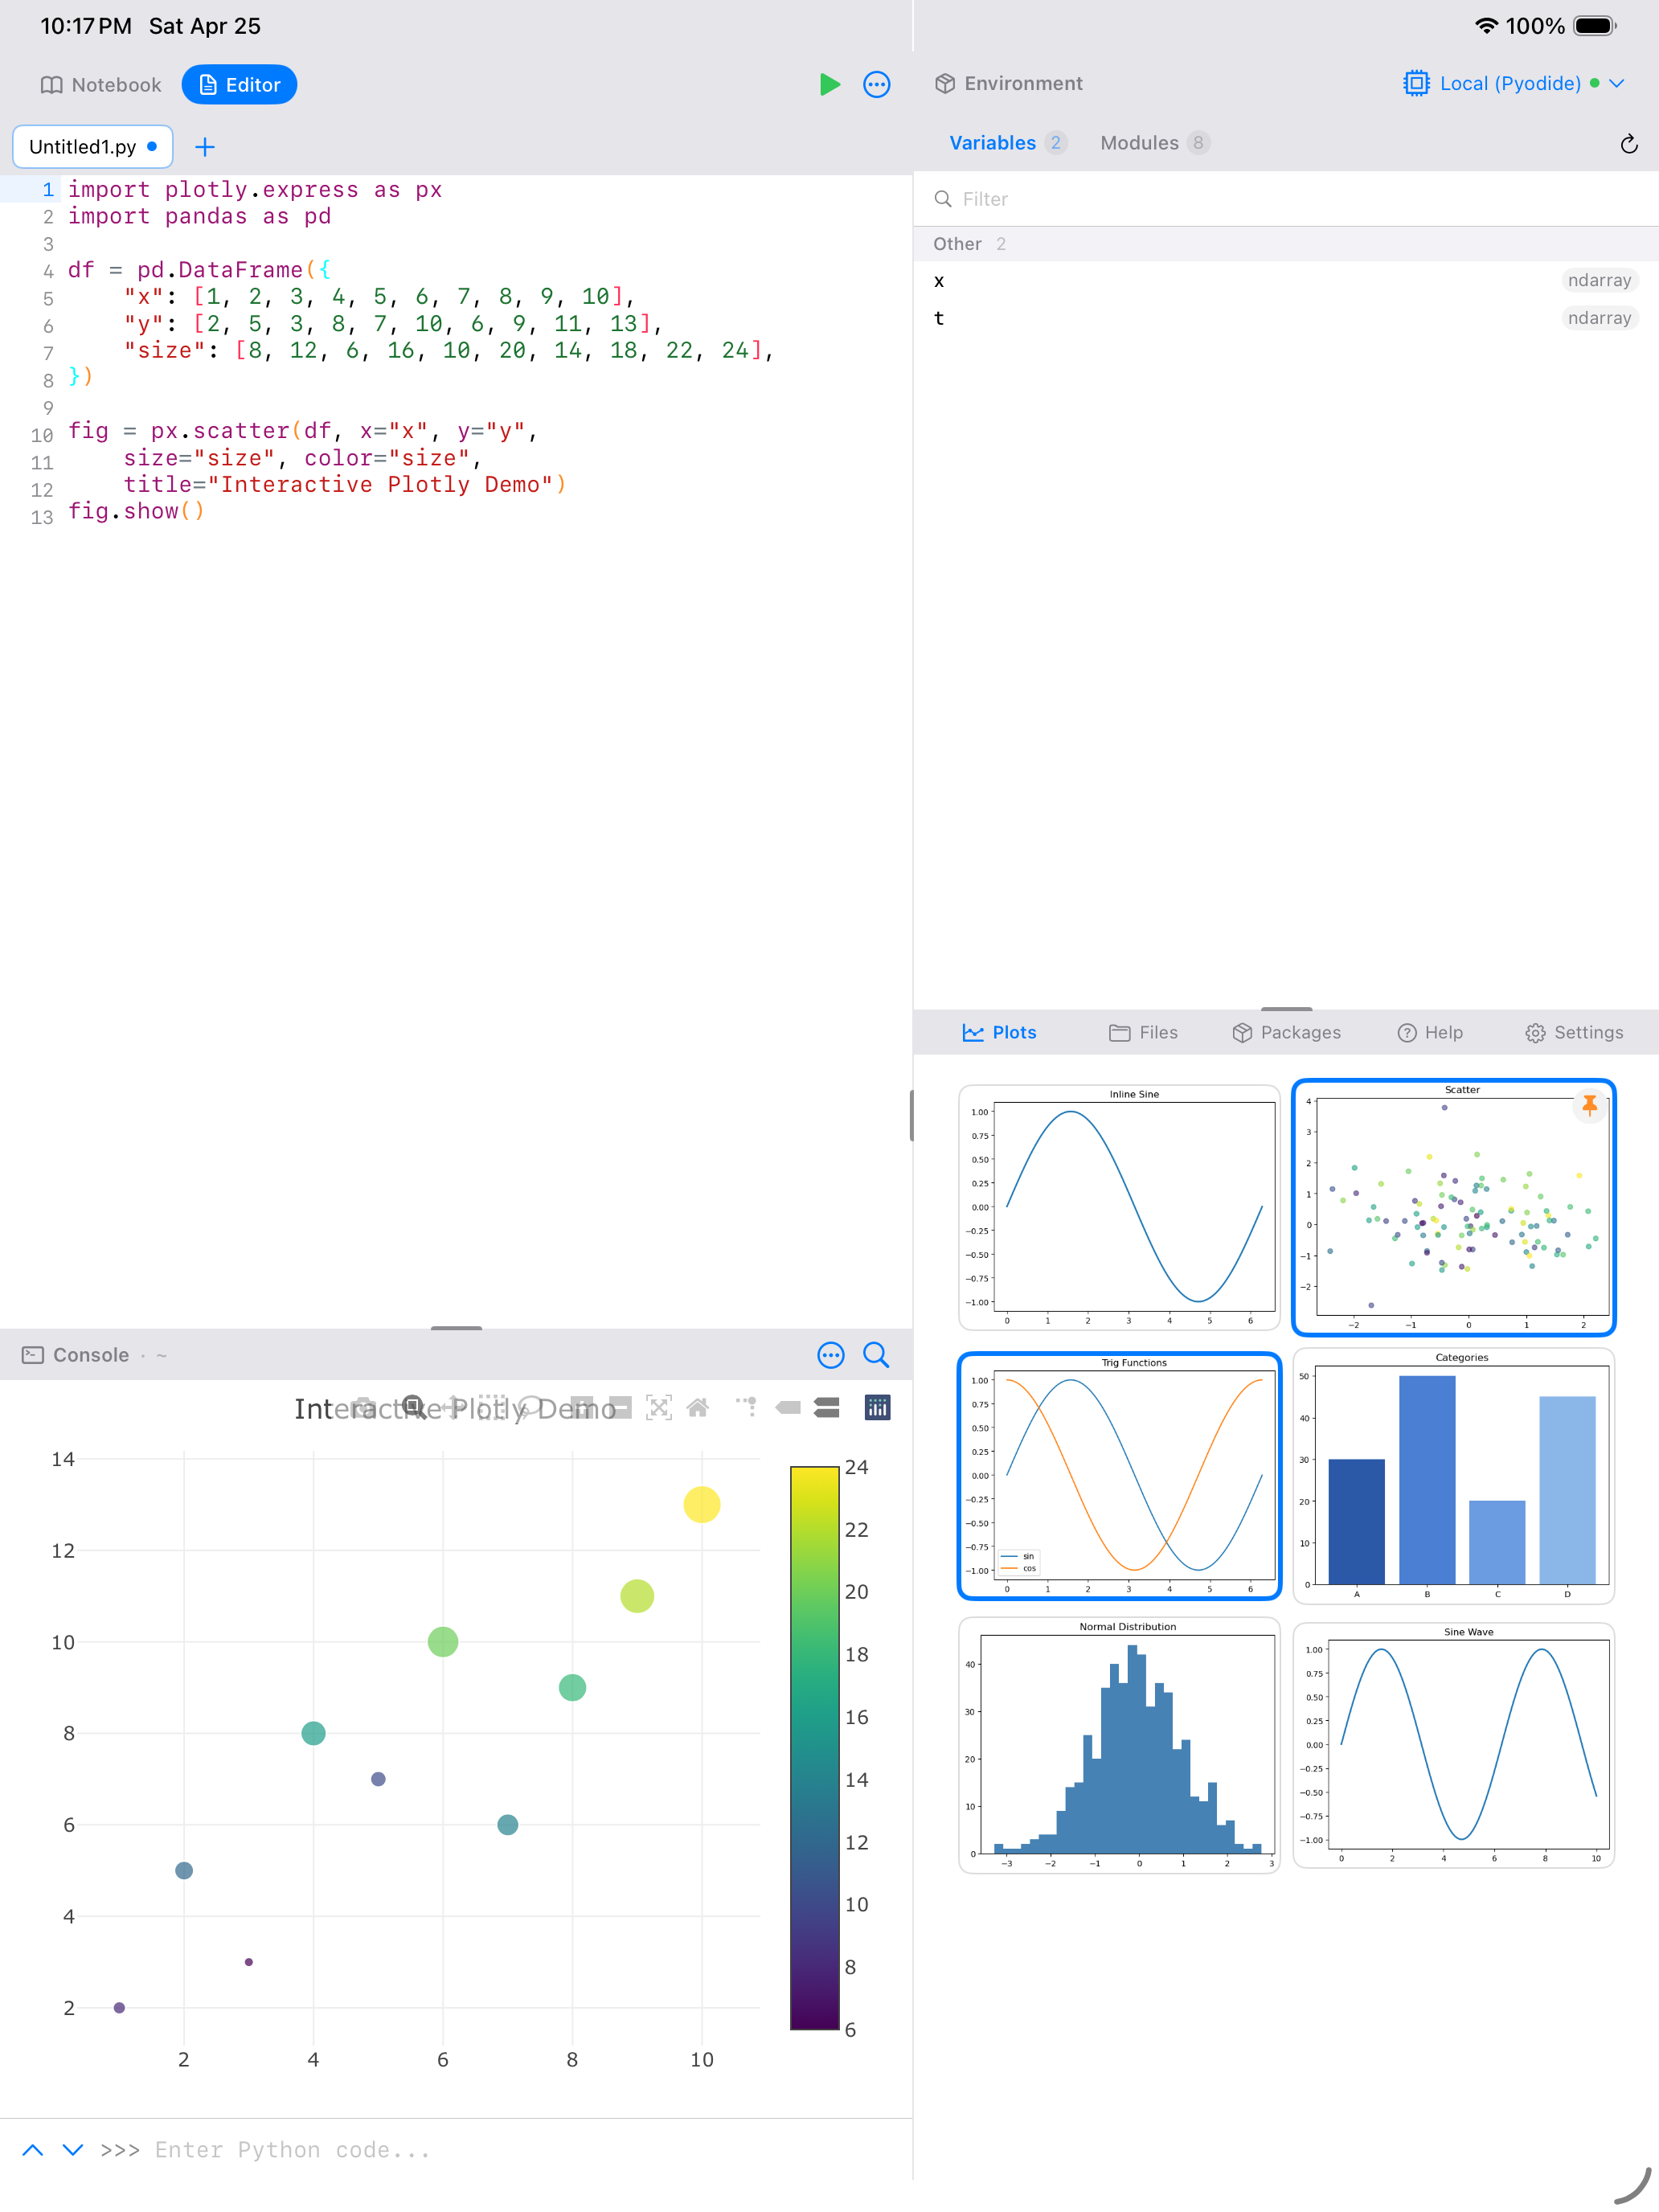
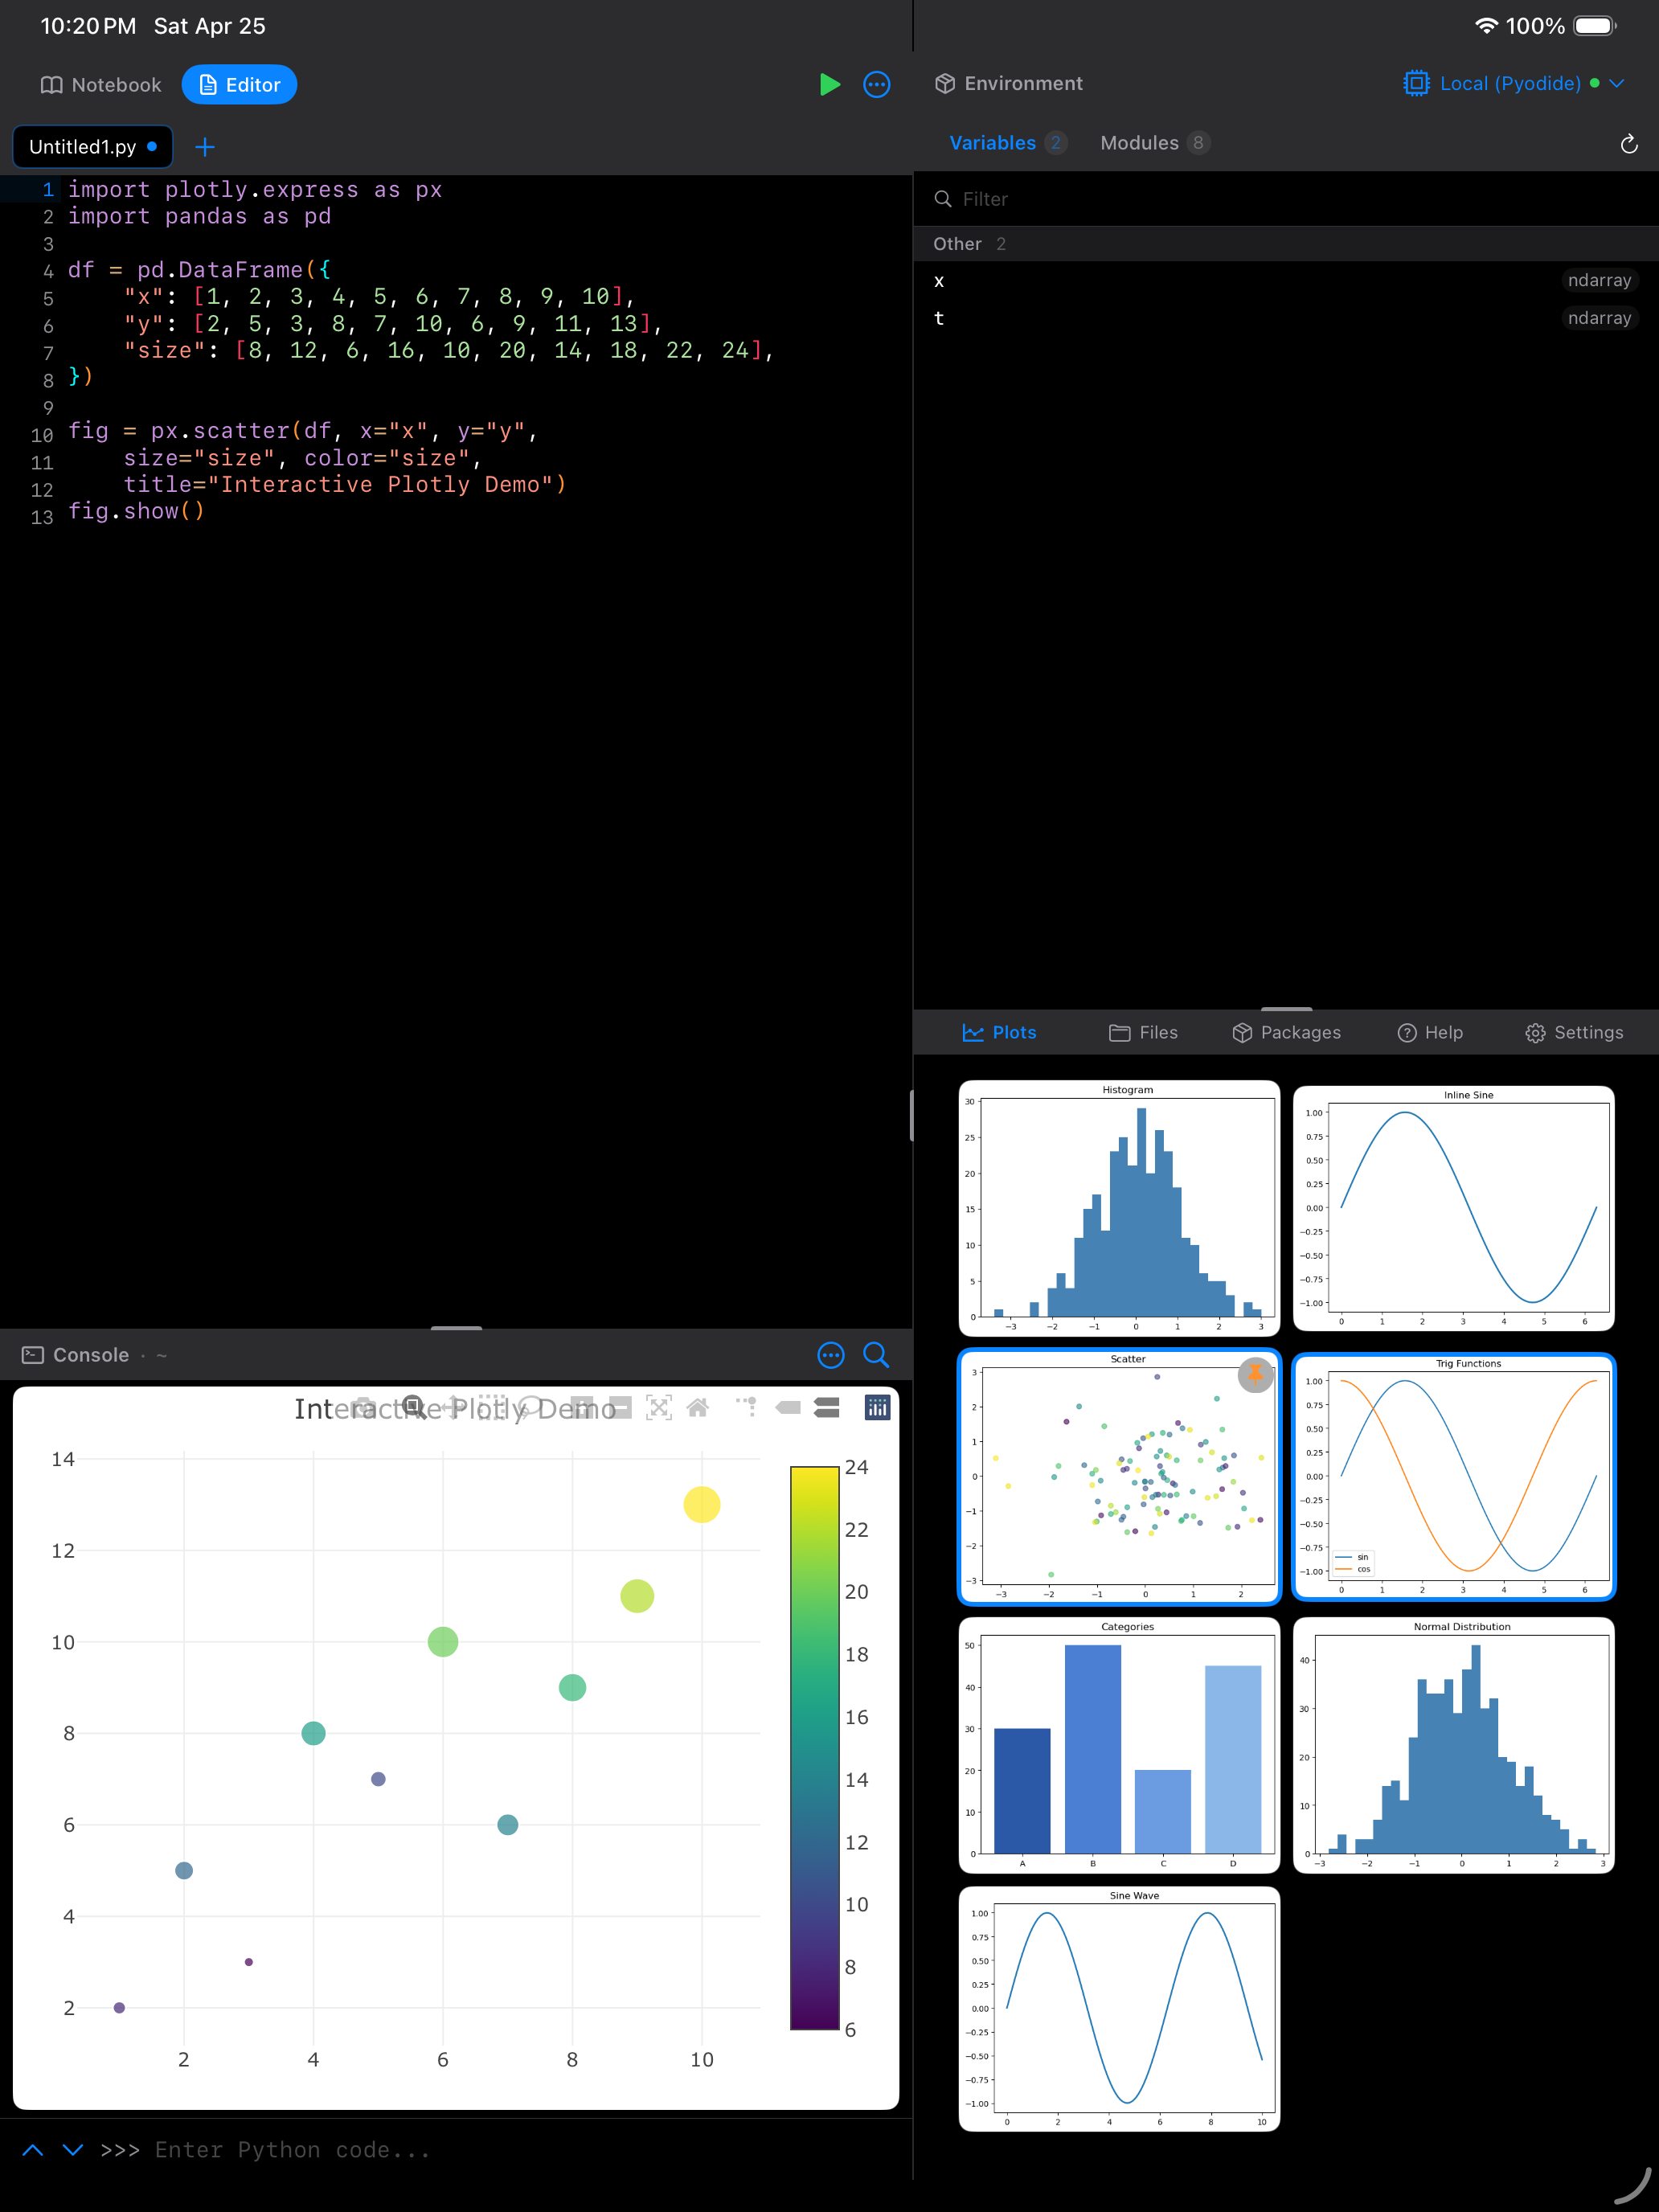
The Plots tab shows all your captured plots as a grid of thumbnails, with the most recent plots at the end. Each thumbnail includes a timestamp so you can tell when it was created.
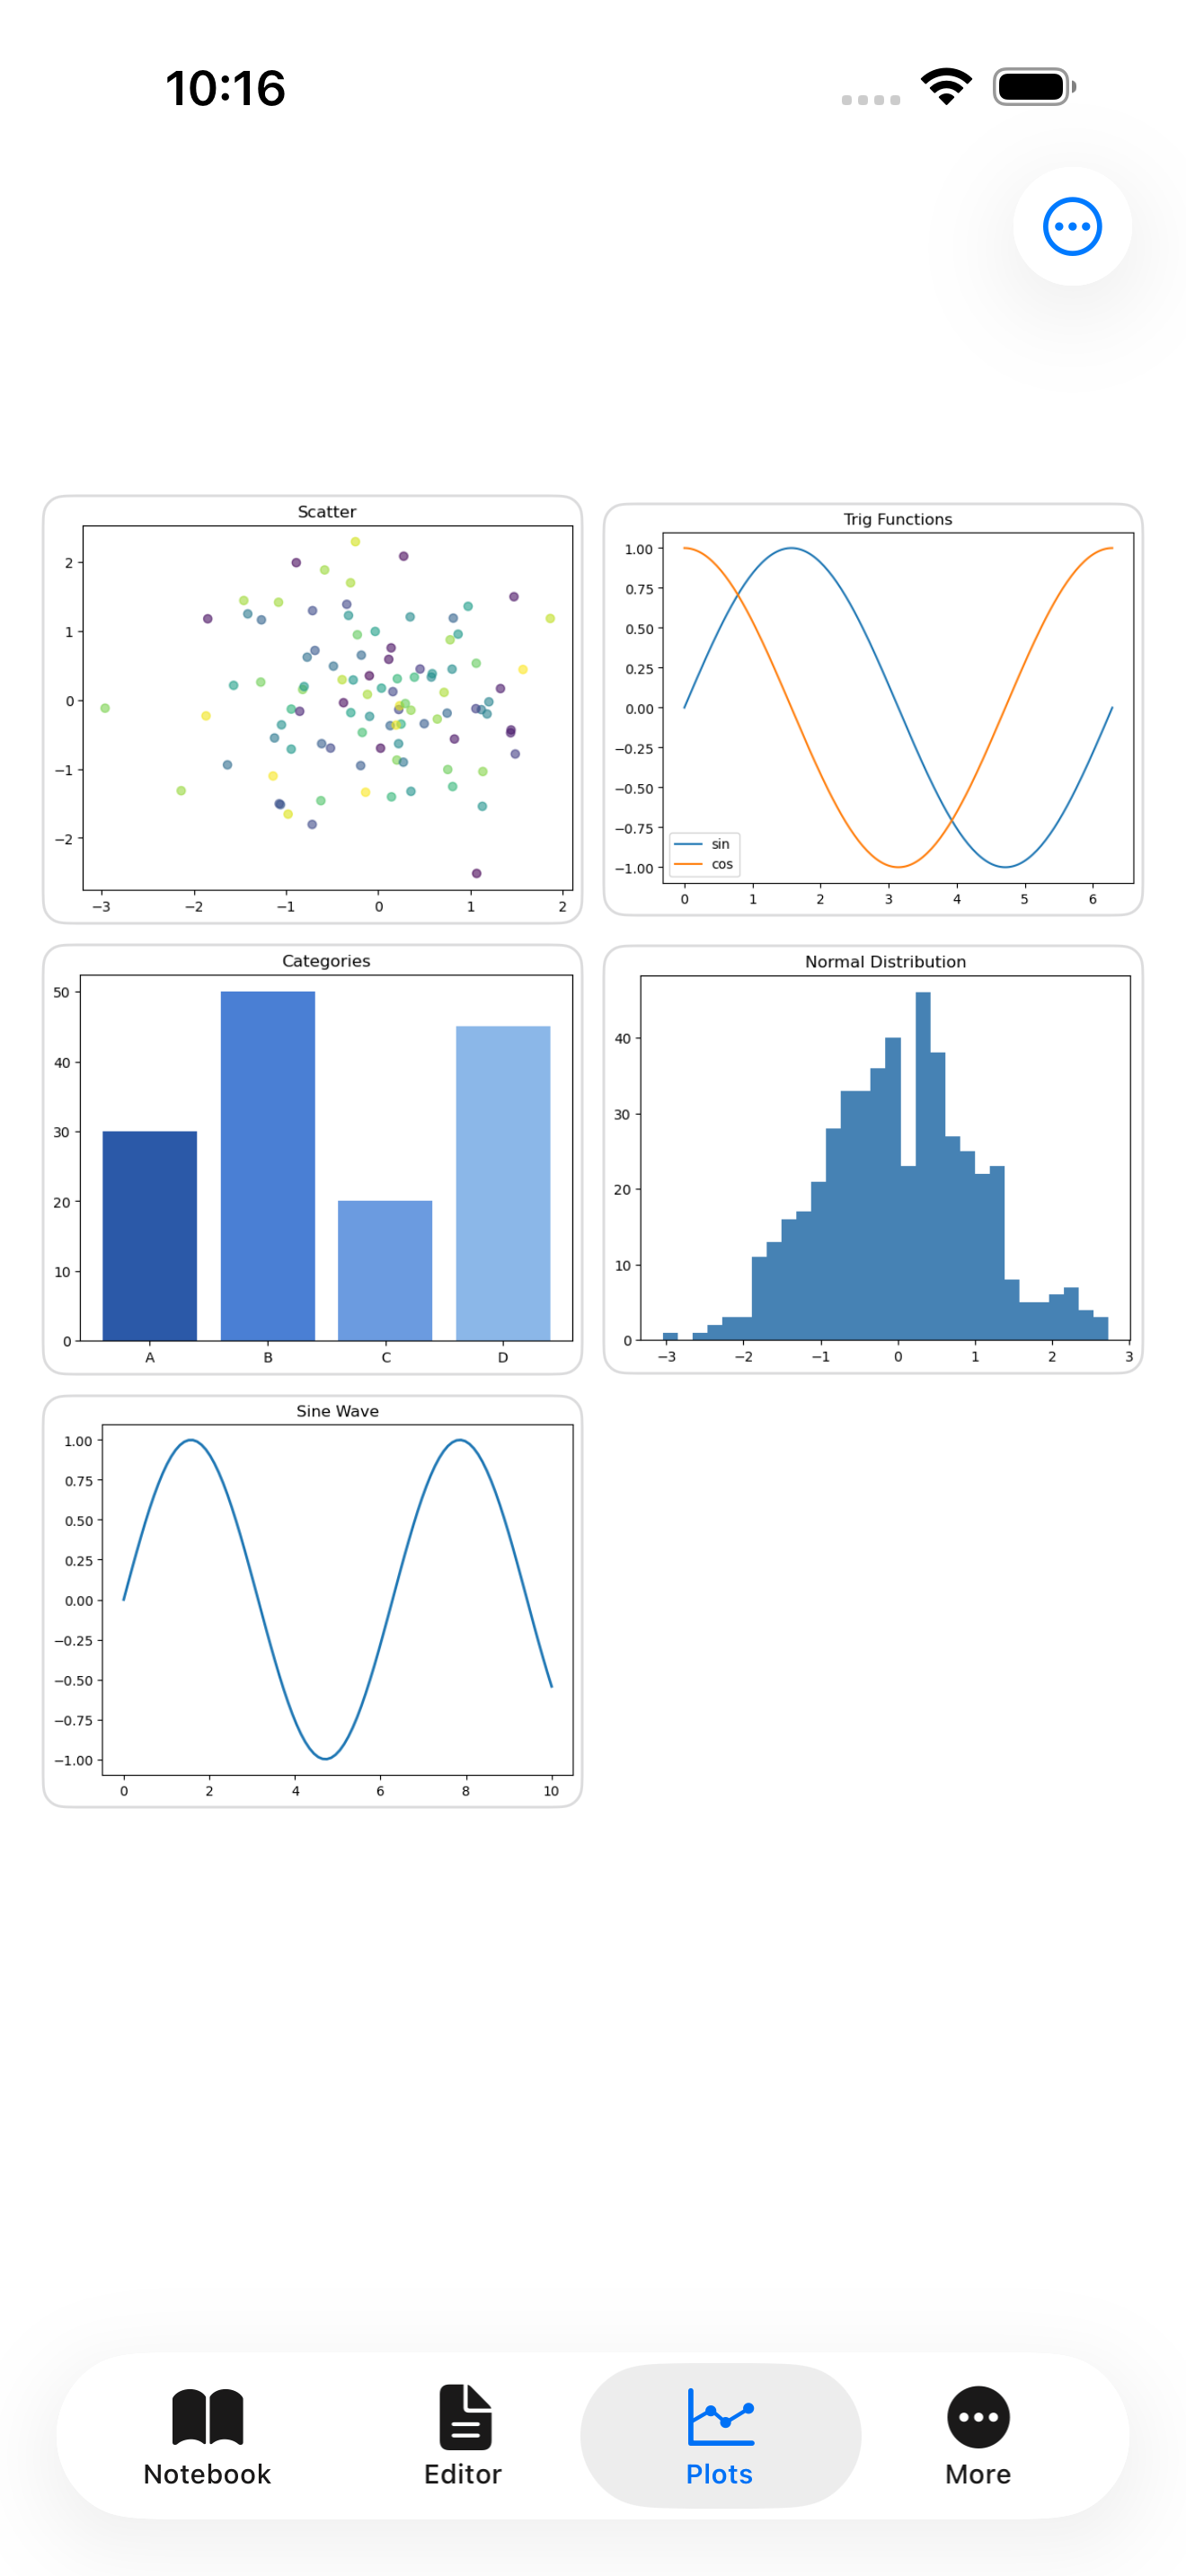
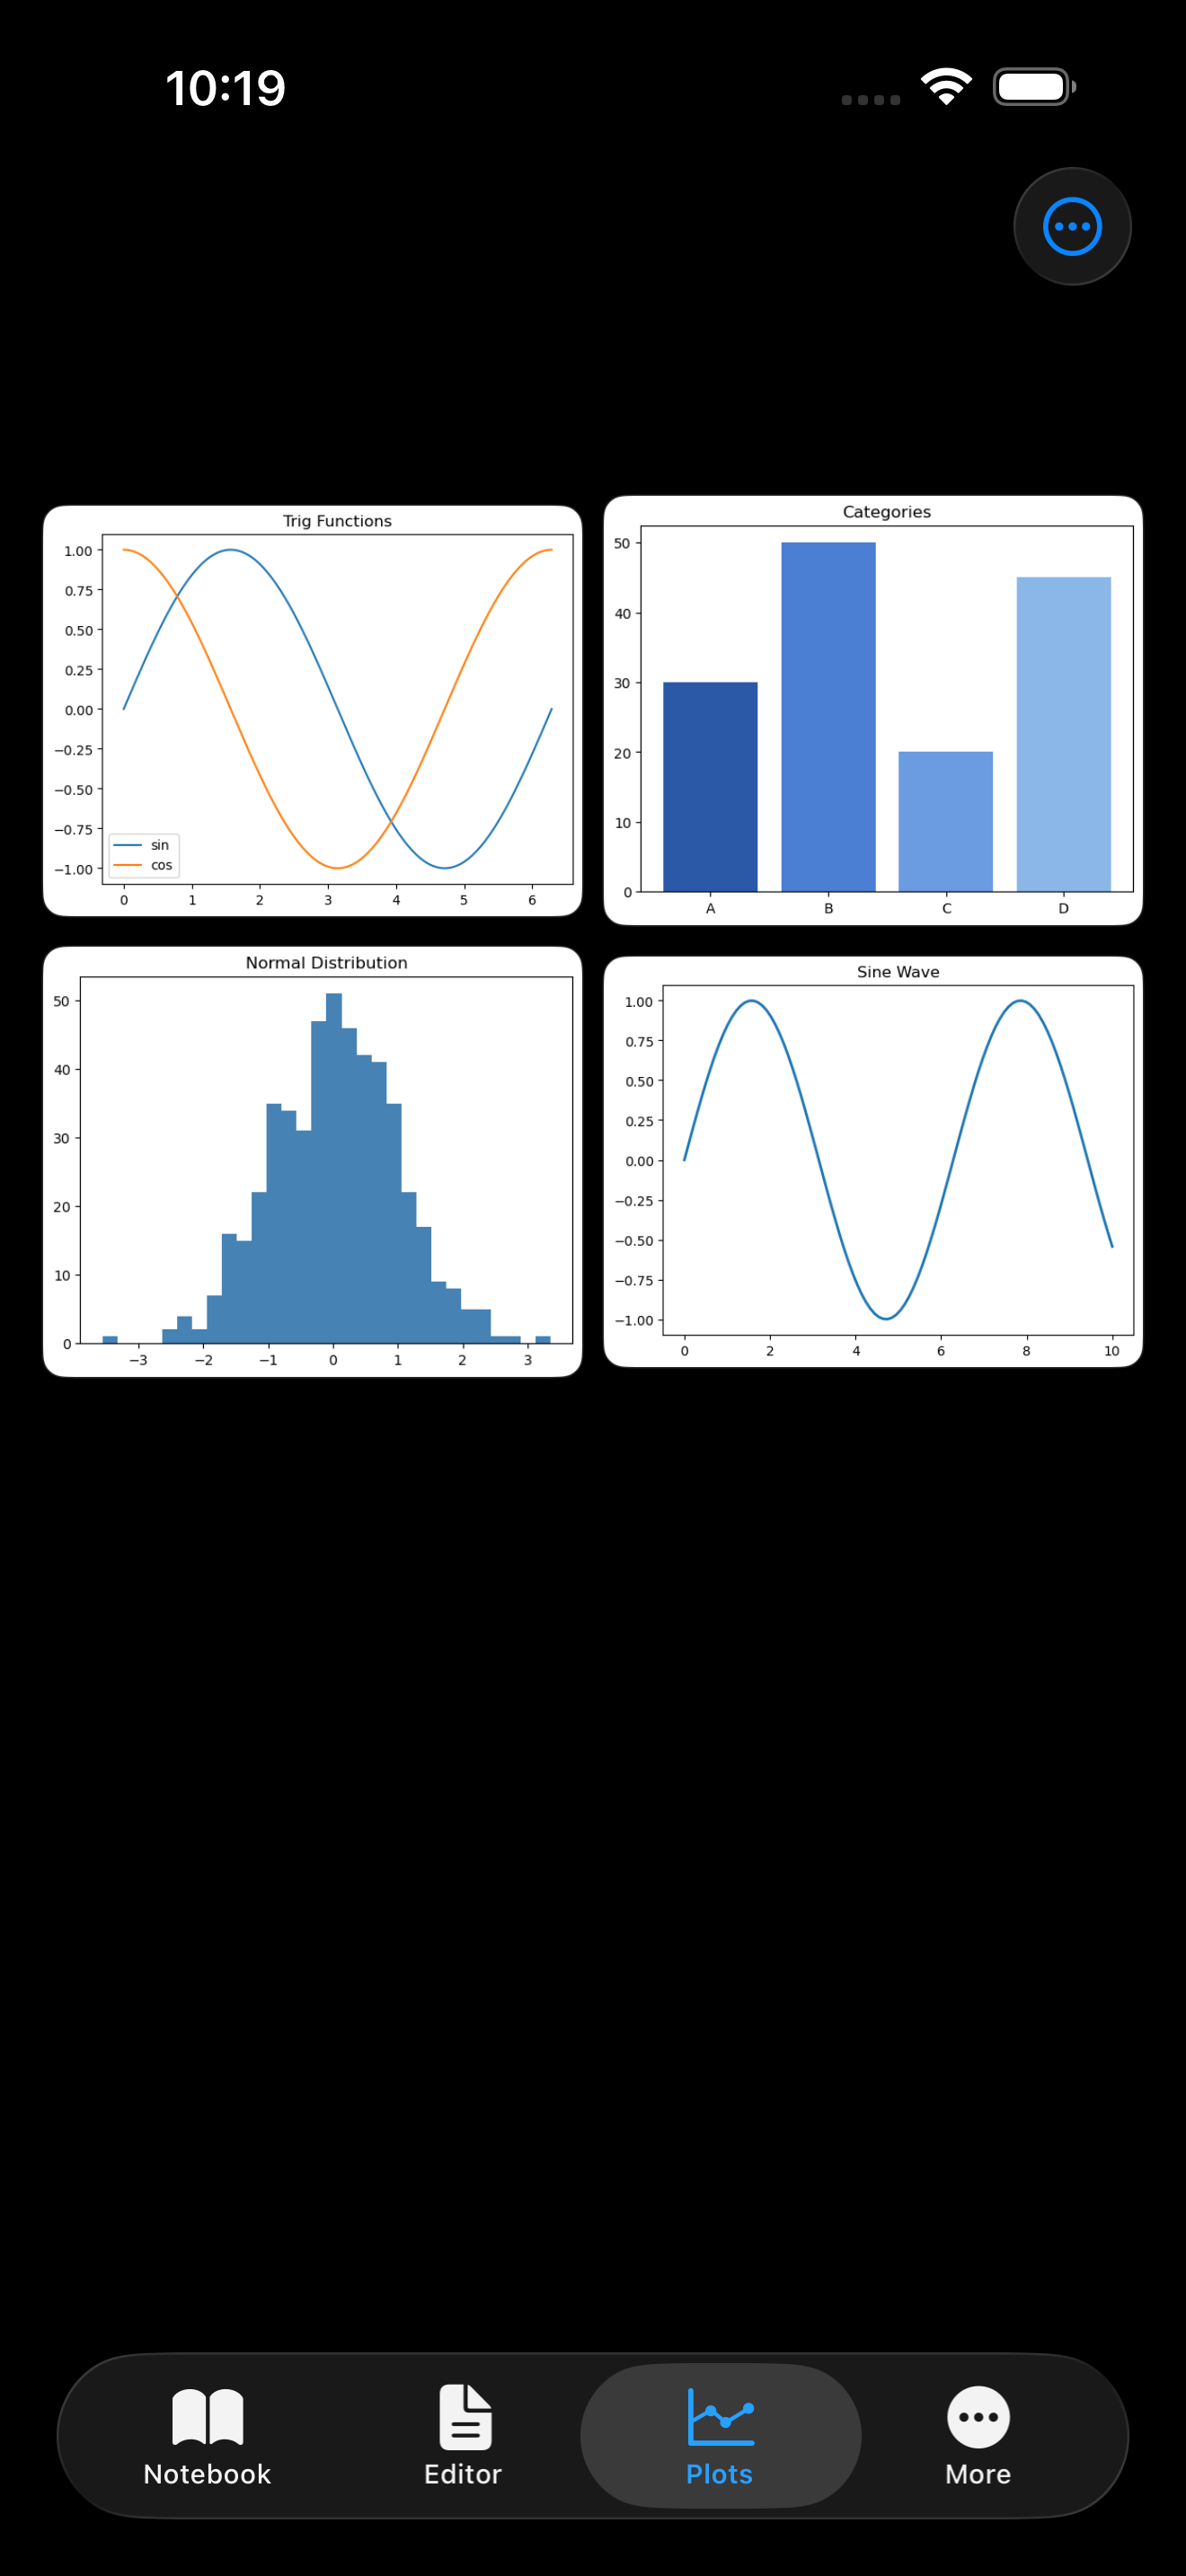
What you are seeing above:
- Thumbnail grid: each plot is shown as a tappable card with the creation time underneath
- Toolbar: provides selection mode, comparison mode, and the overflow menu for managing plots
- NEW badge: freshly created plots get a brief highlight animation so you can spot them
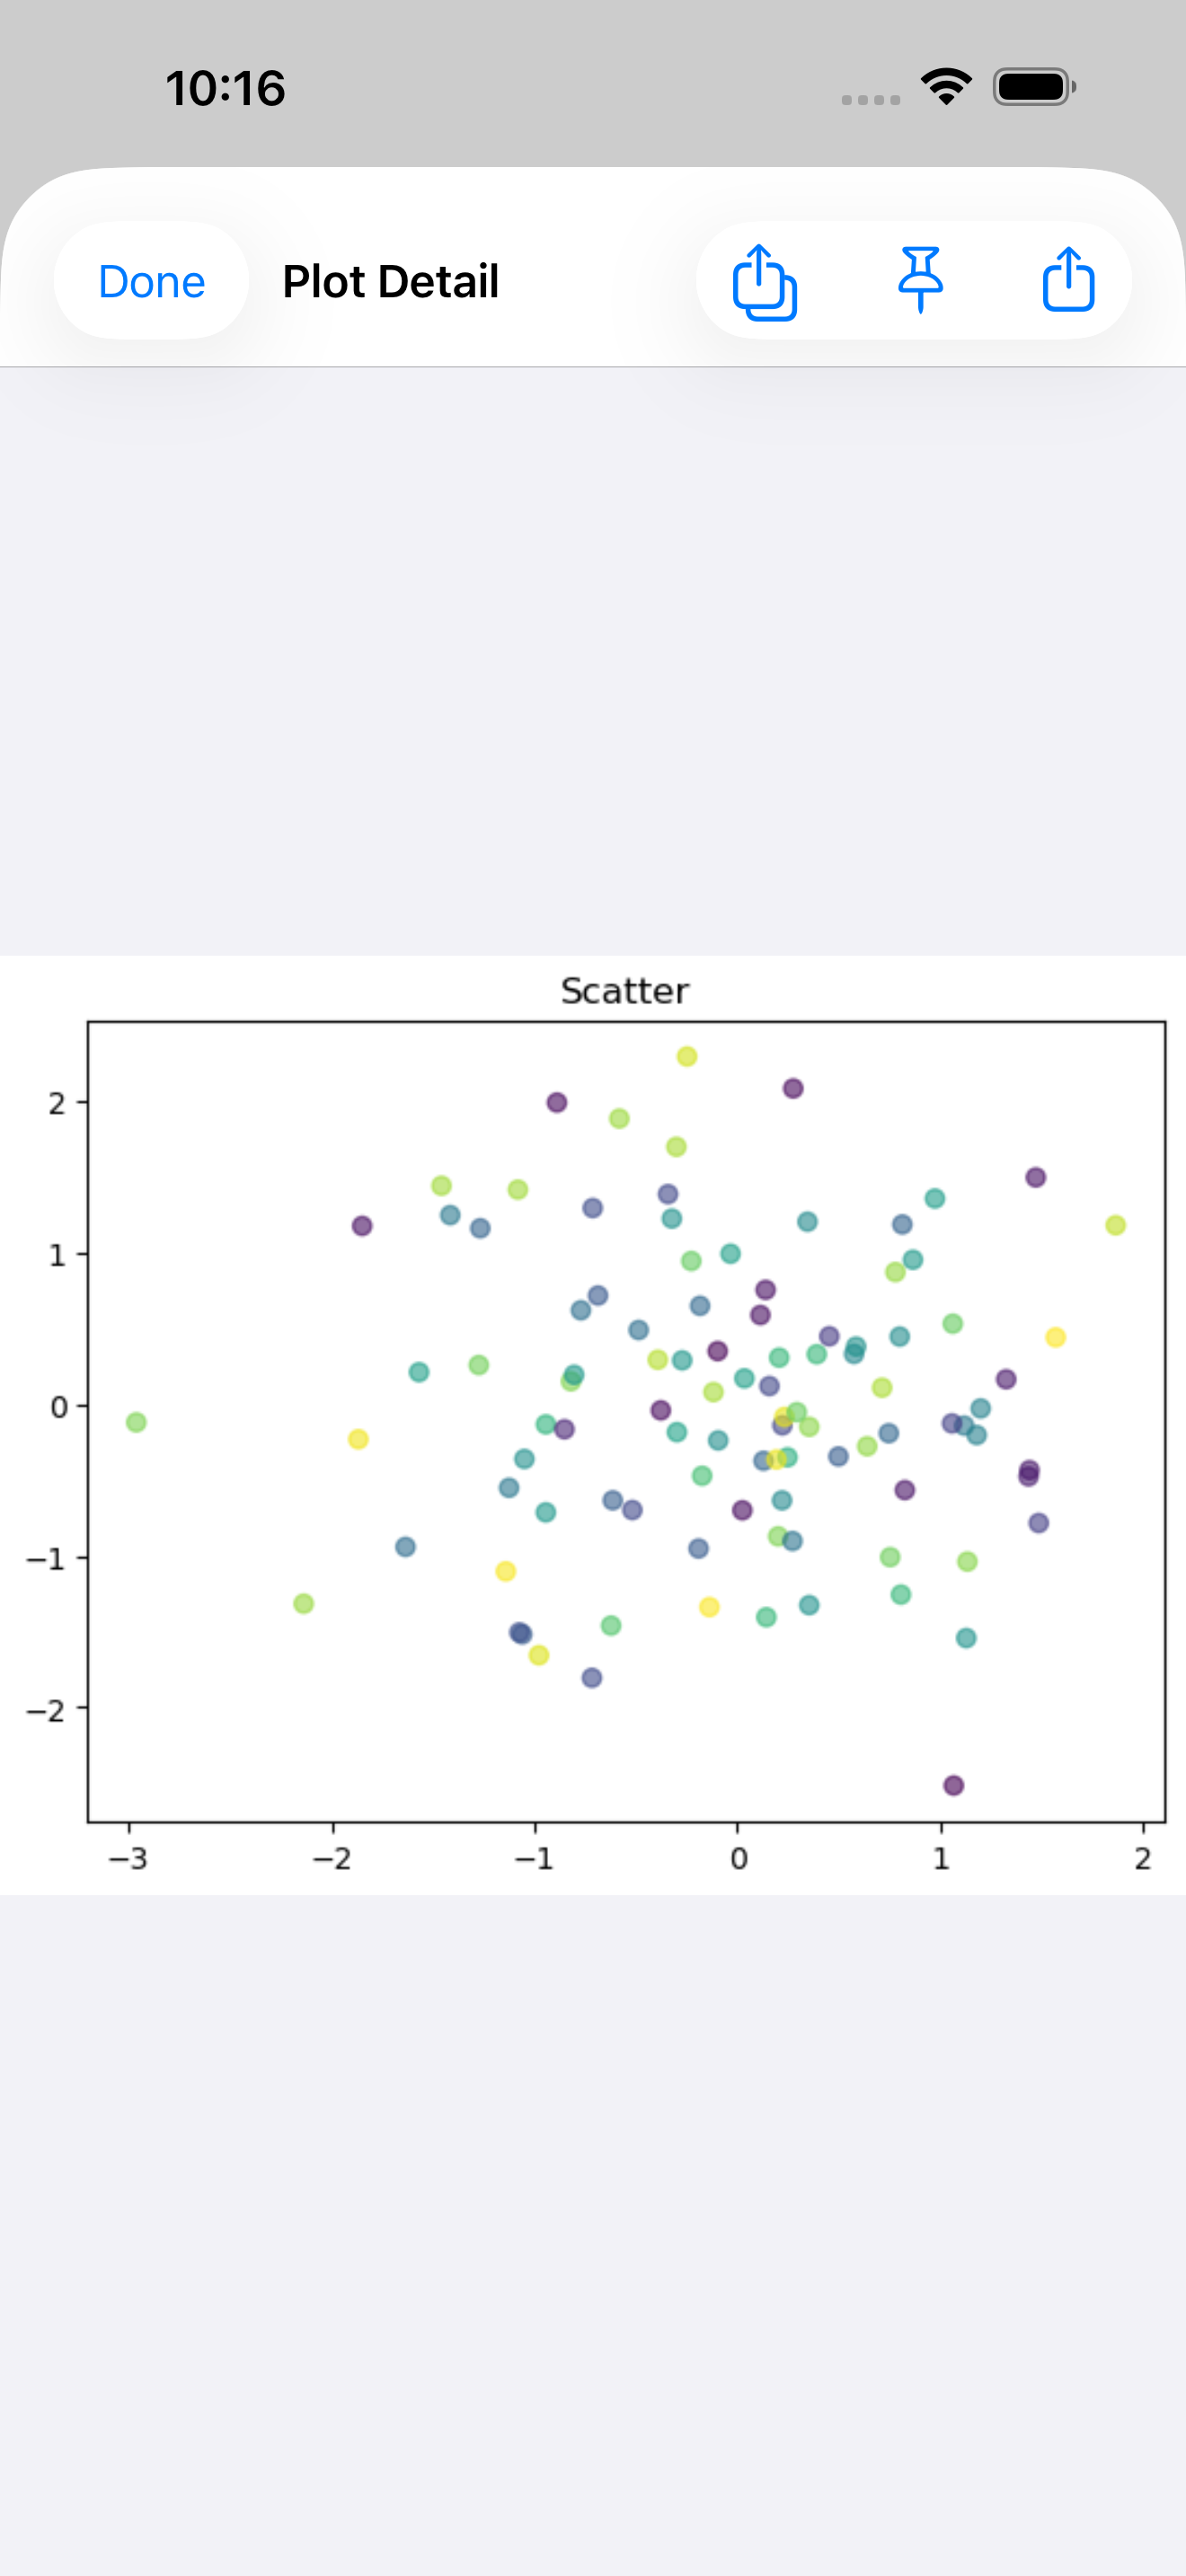
Tap any thumbnail to open the full-size detail view, where you can pinch to zoom from 0.5x up to 5x magnification, drag to pan when zoomed in, and double-tap to toggle between 1x and 2x zoom.
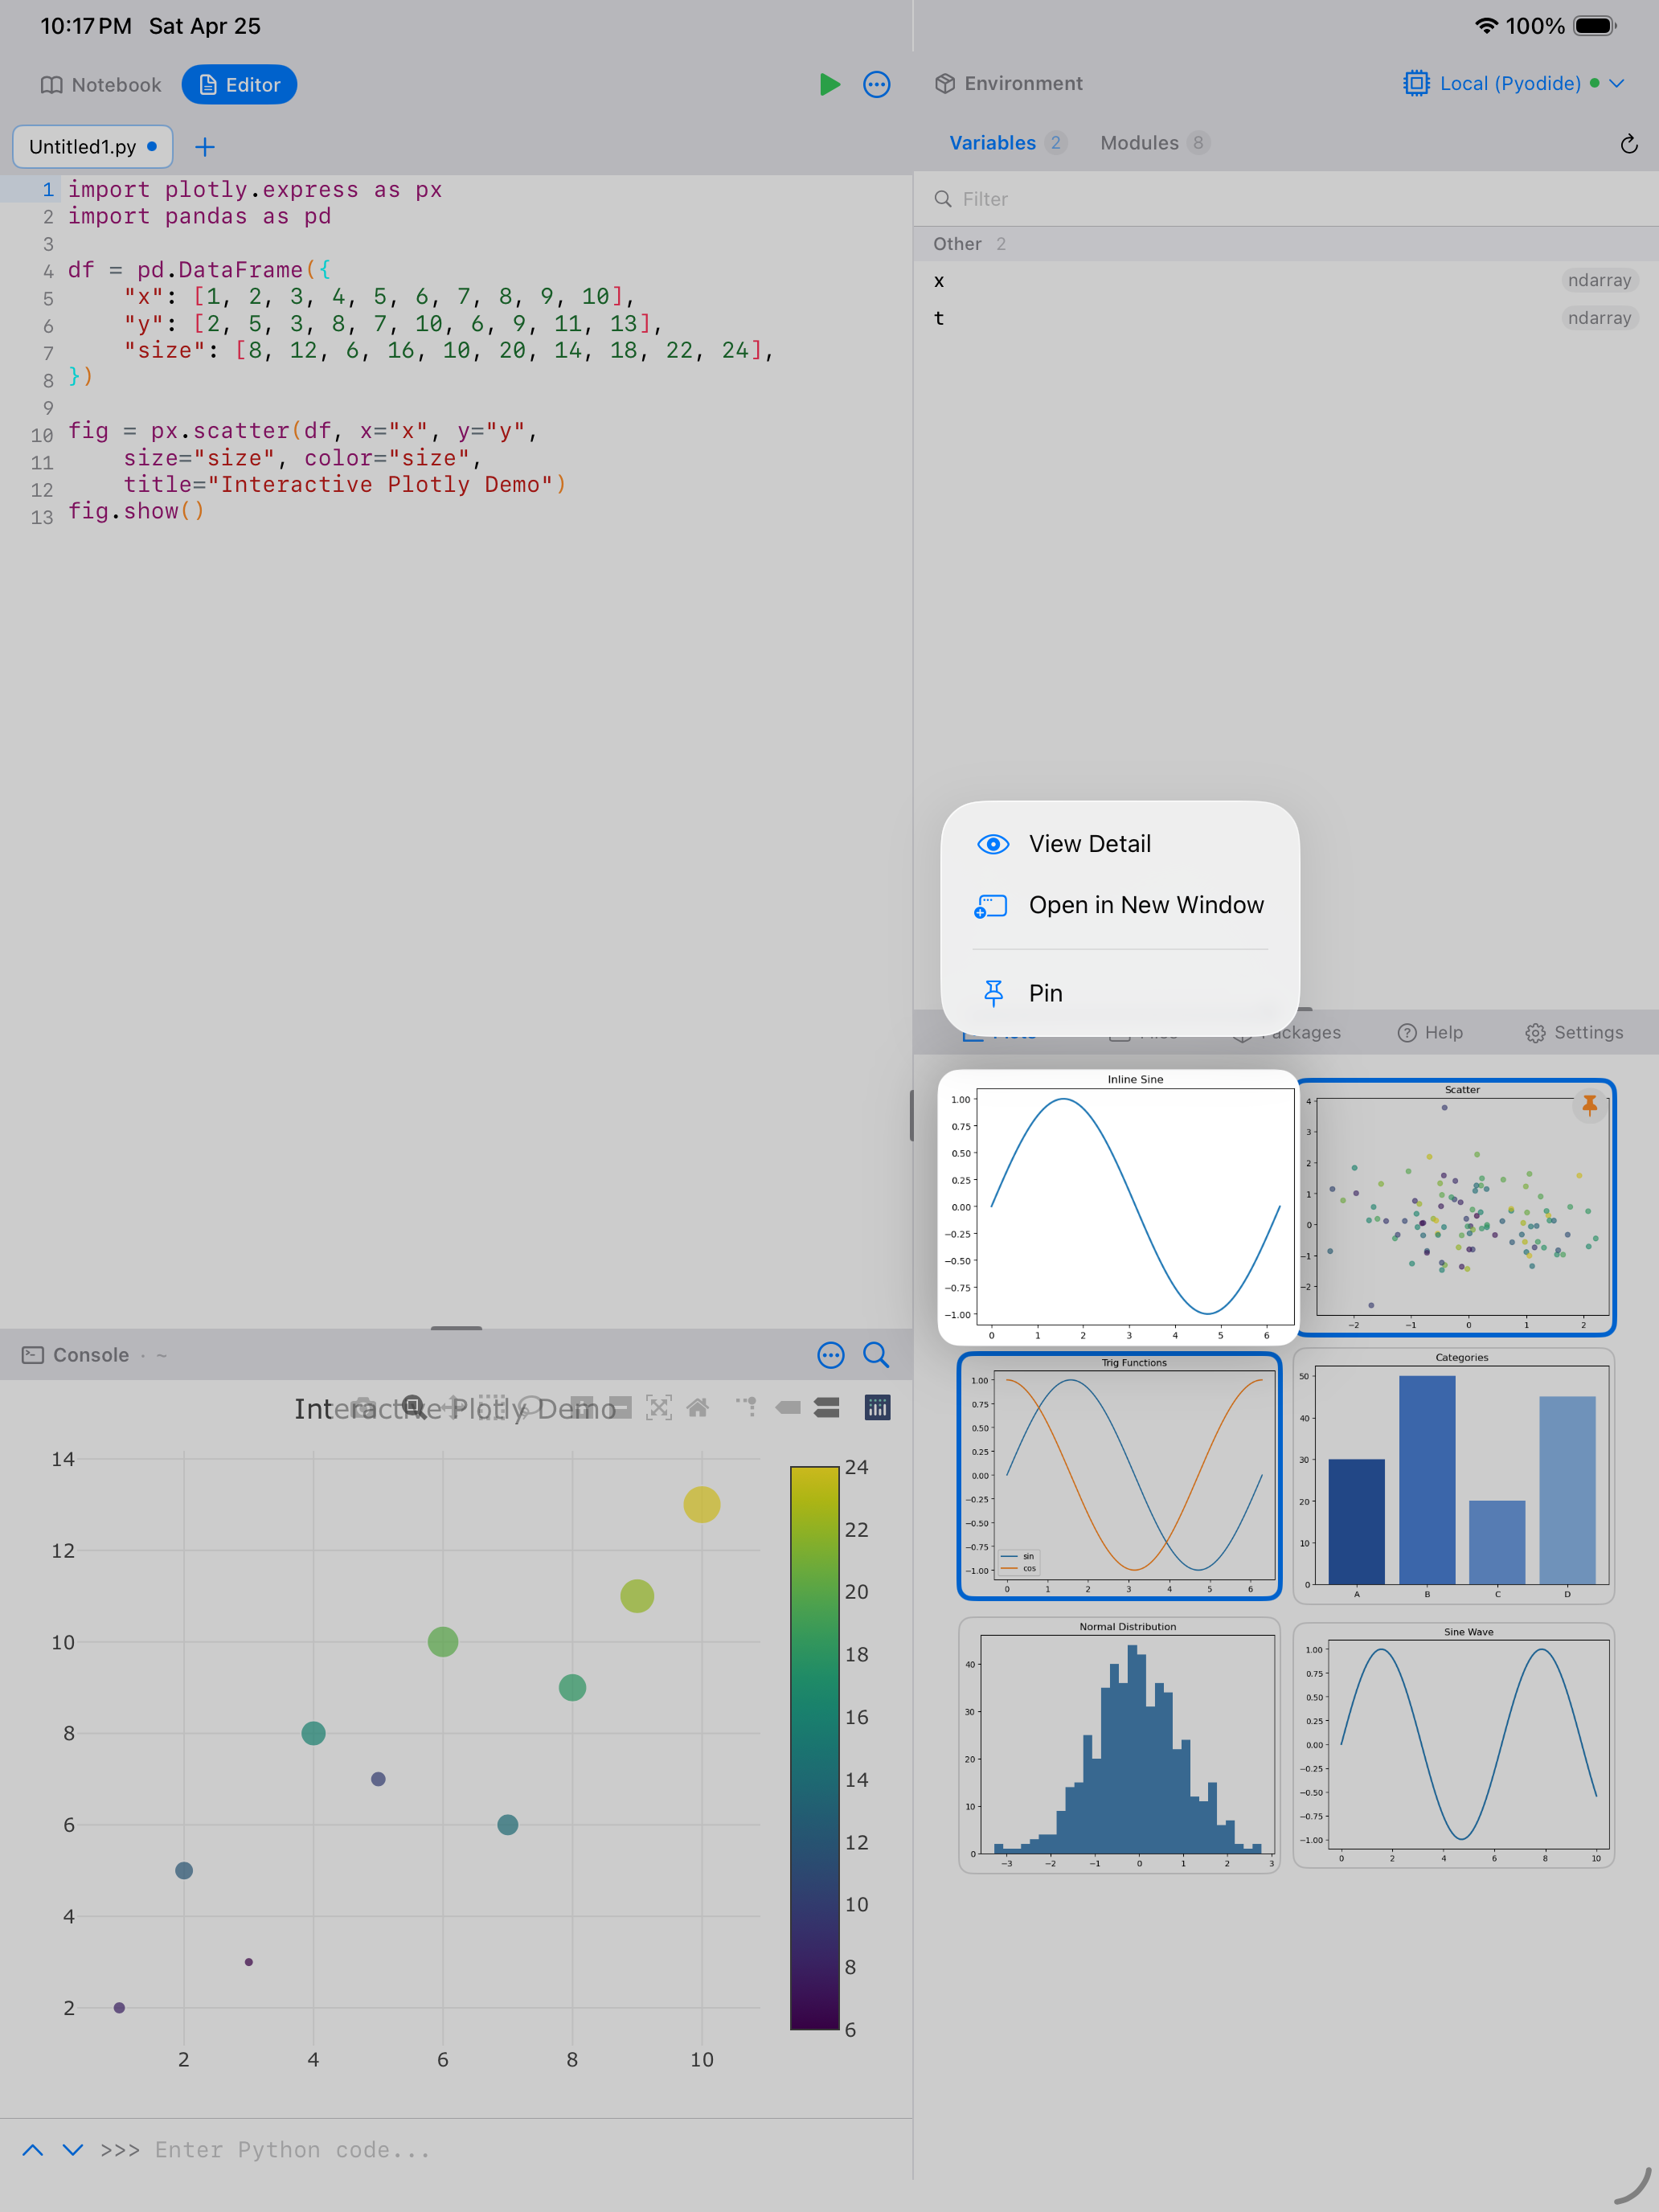
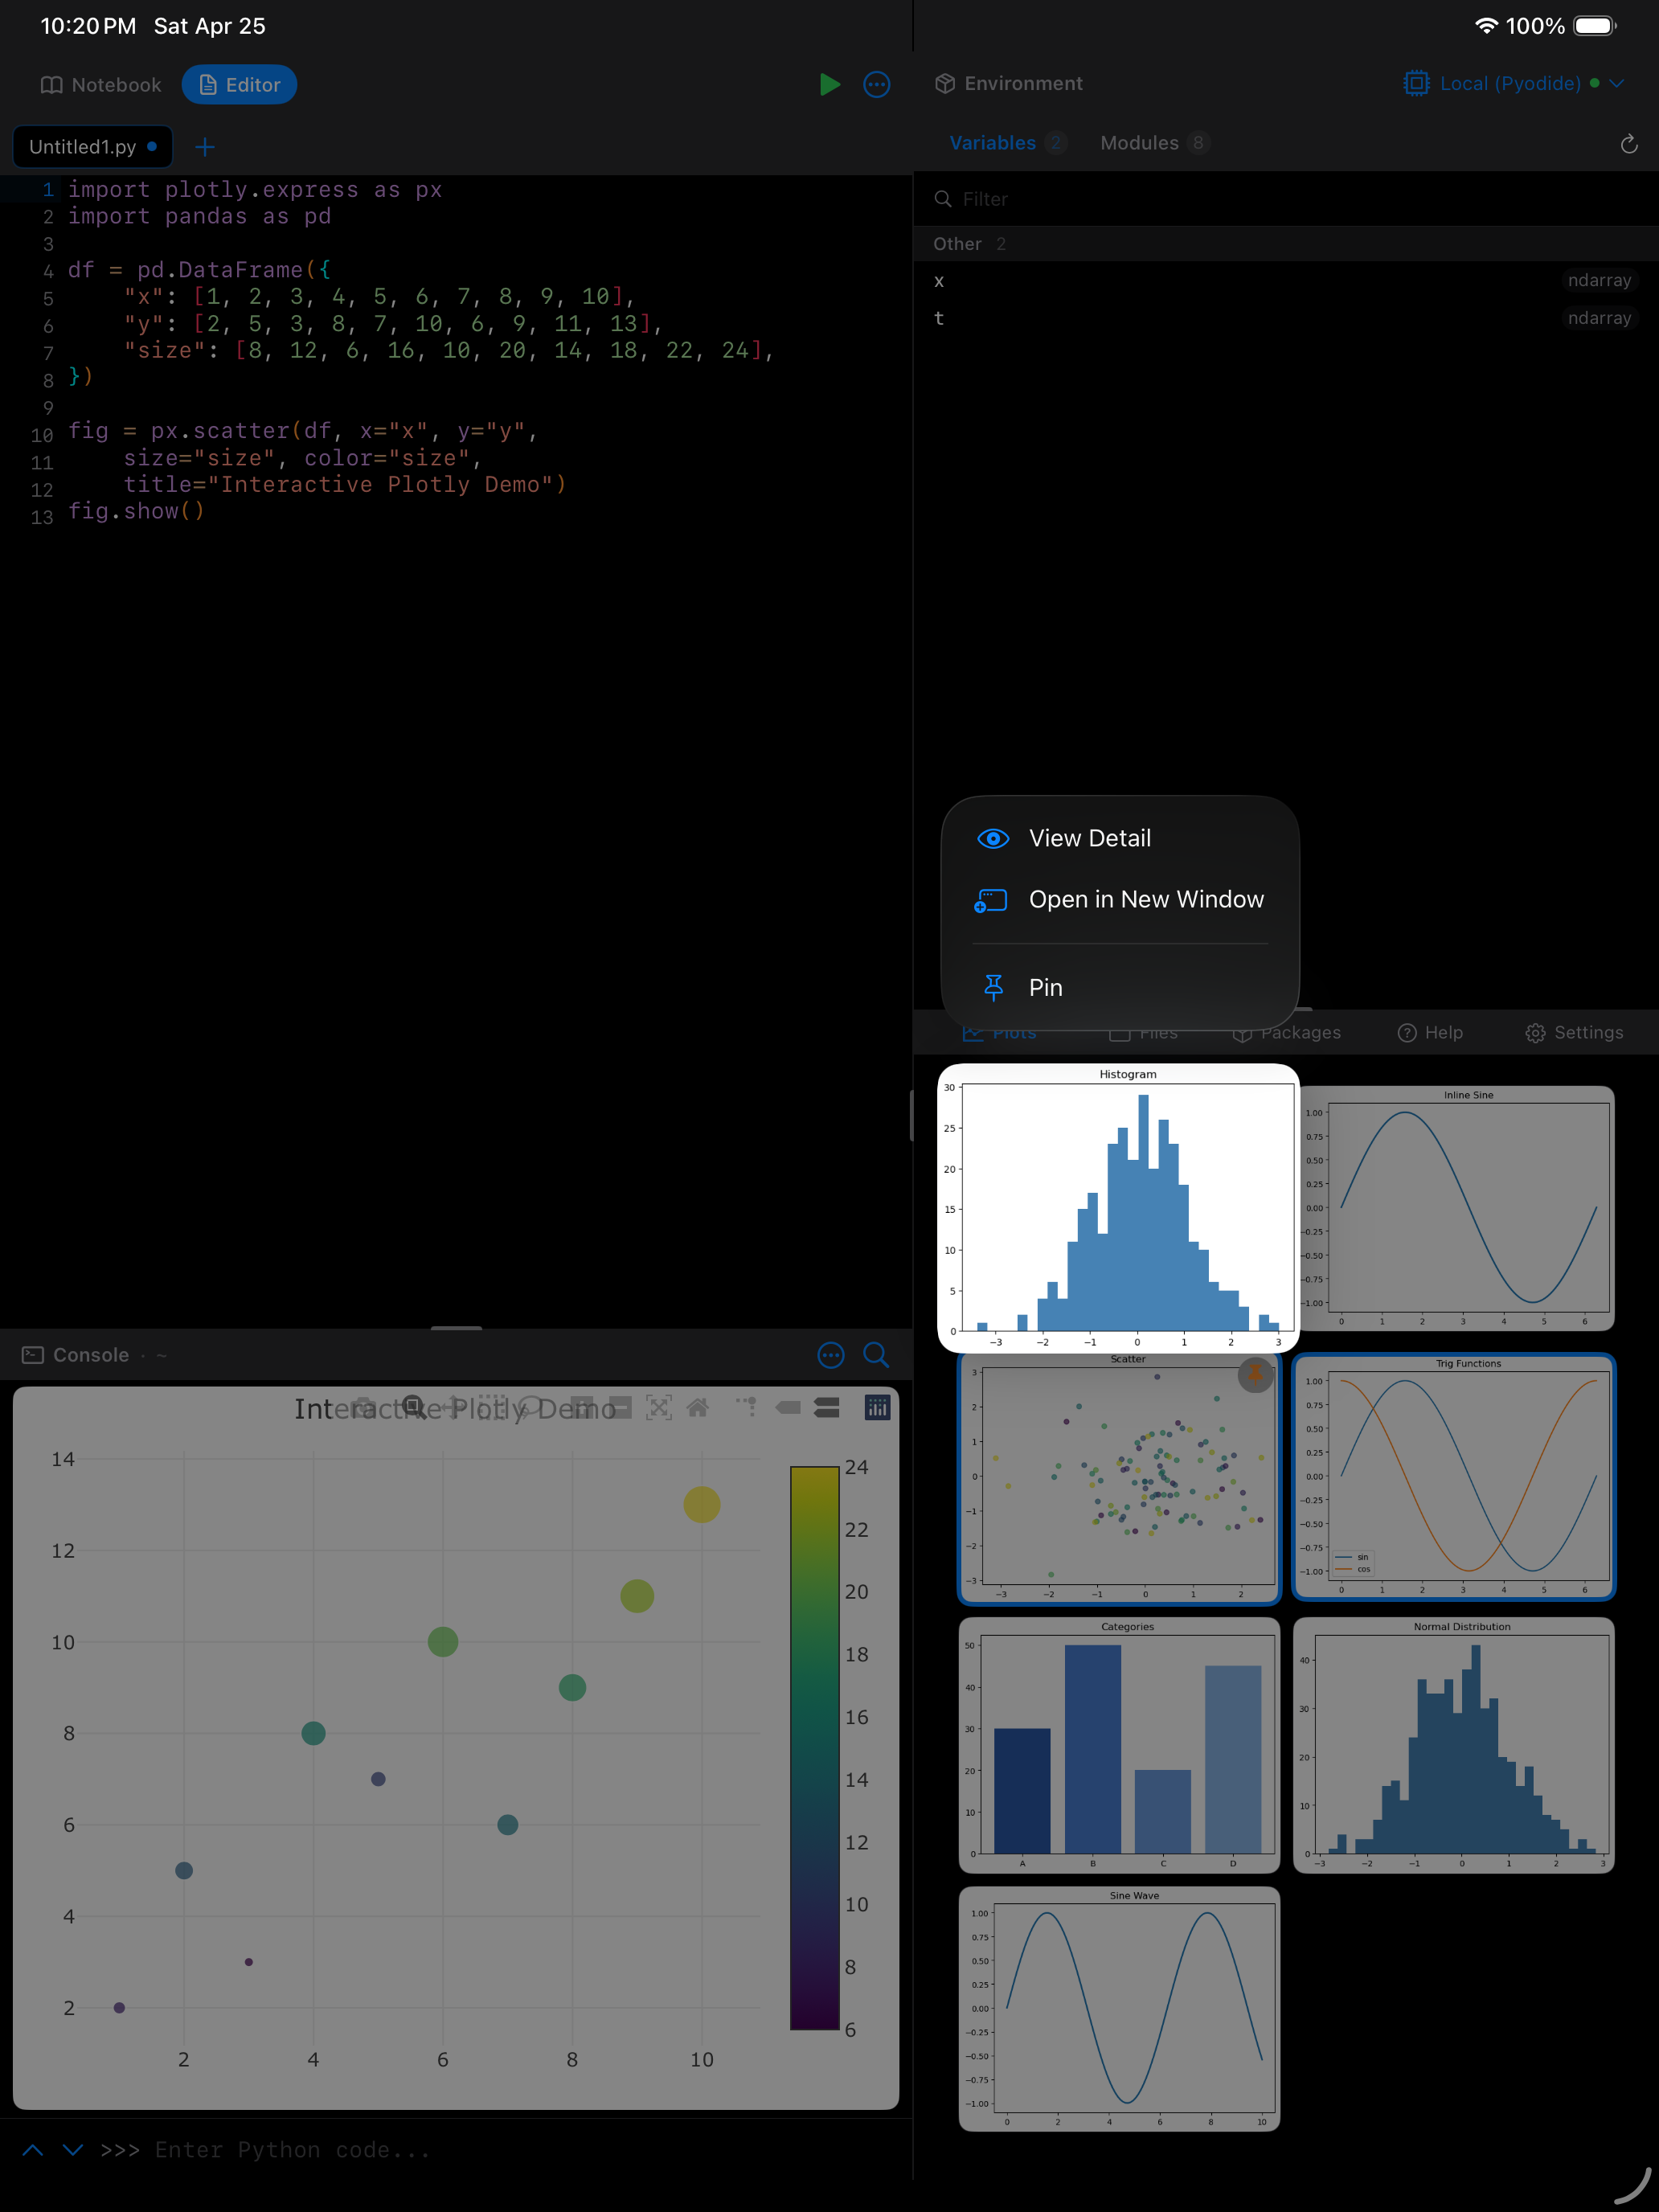
Pinning Plots
If there is a plot you want to keep safe while clearing others, long-press the thumbnail and choose Pin, or open the plot in the detail view and tap the pin button in the toolbar. Pinned plots get an orange pin badge and are protected from deletion. You will need to unpin them first before you can delete them. This is handy when you have one “good” version of a chart and want to freely experiment without accidentally losing it.


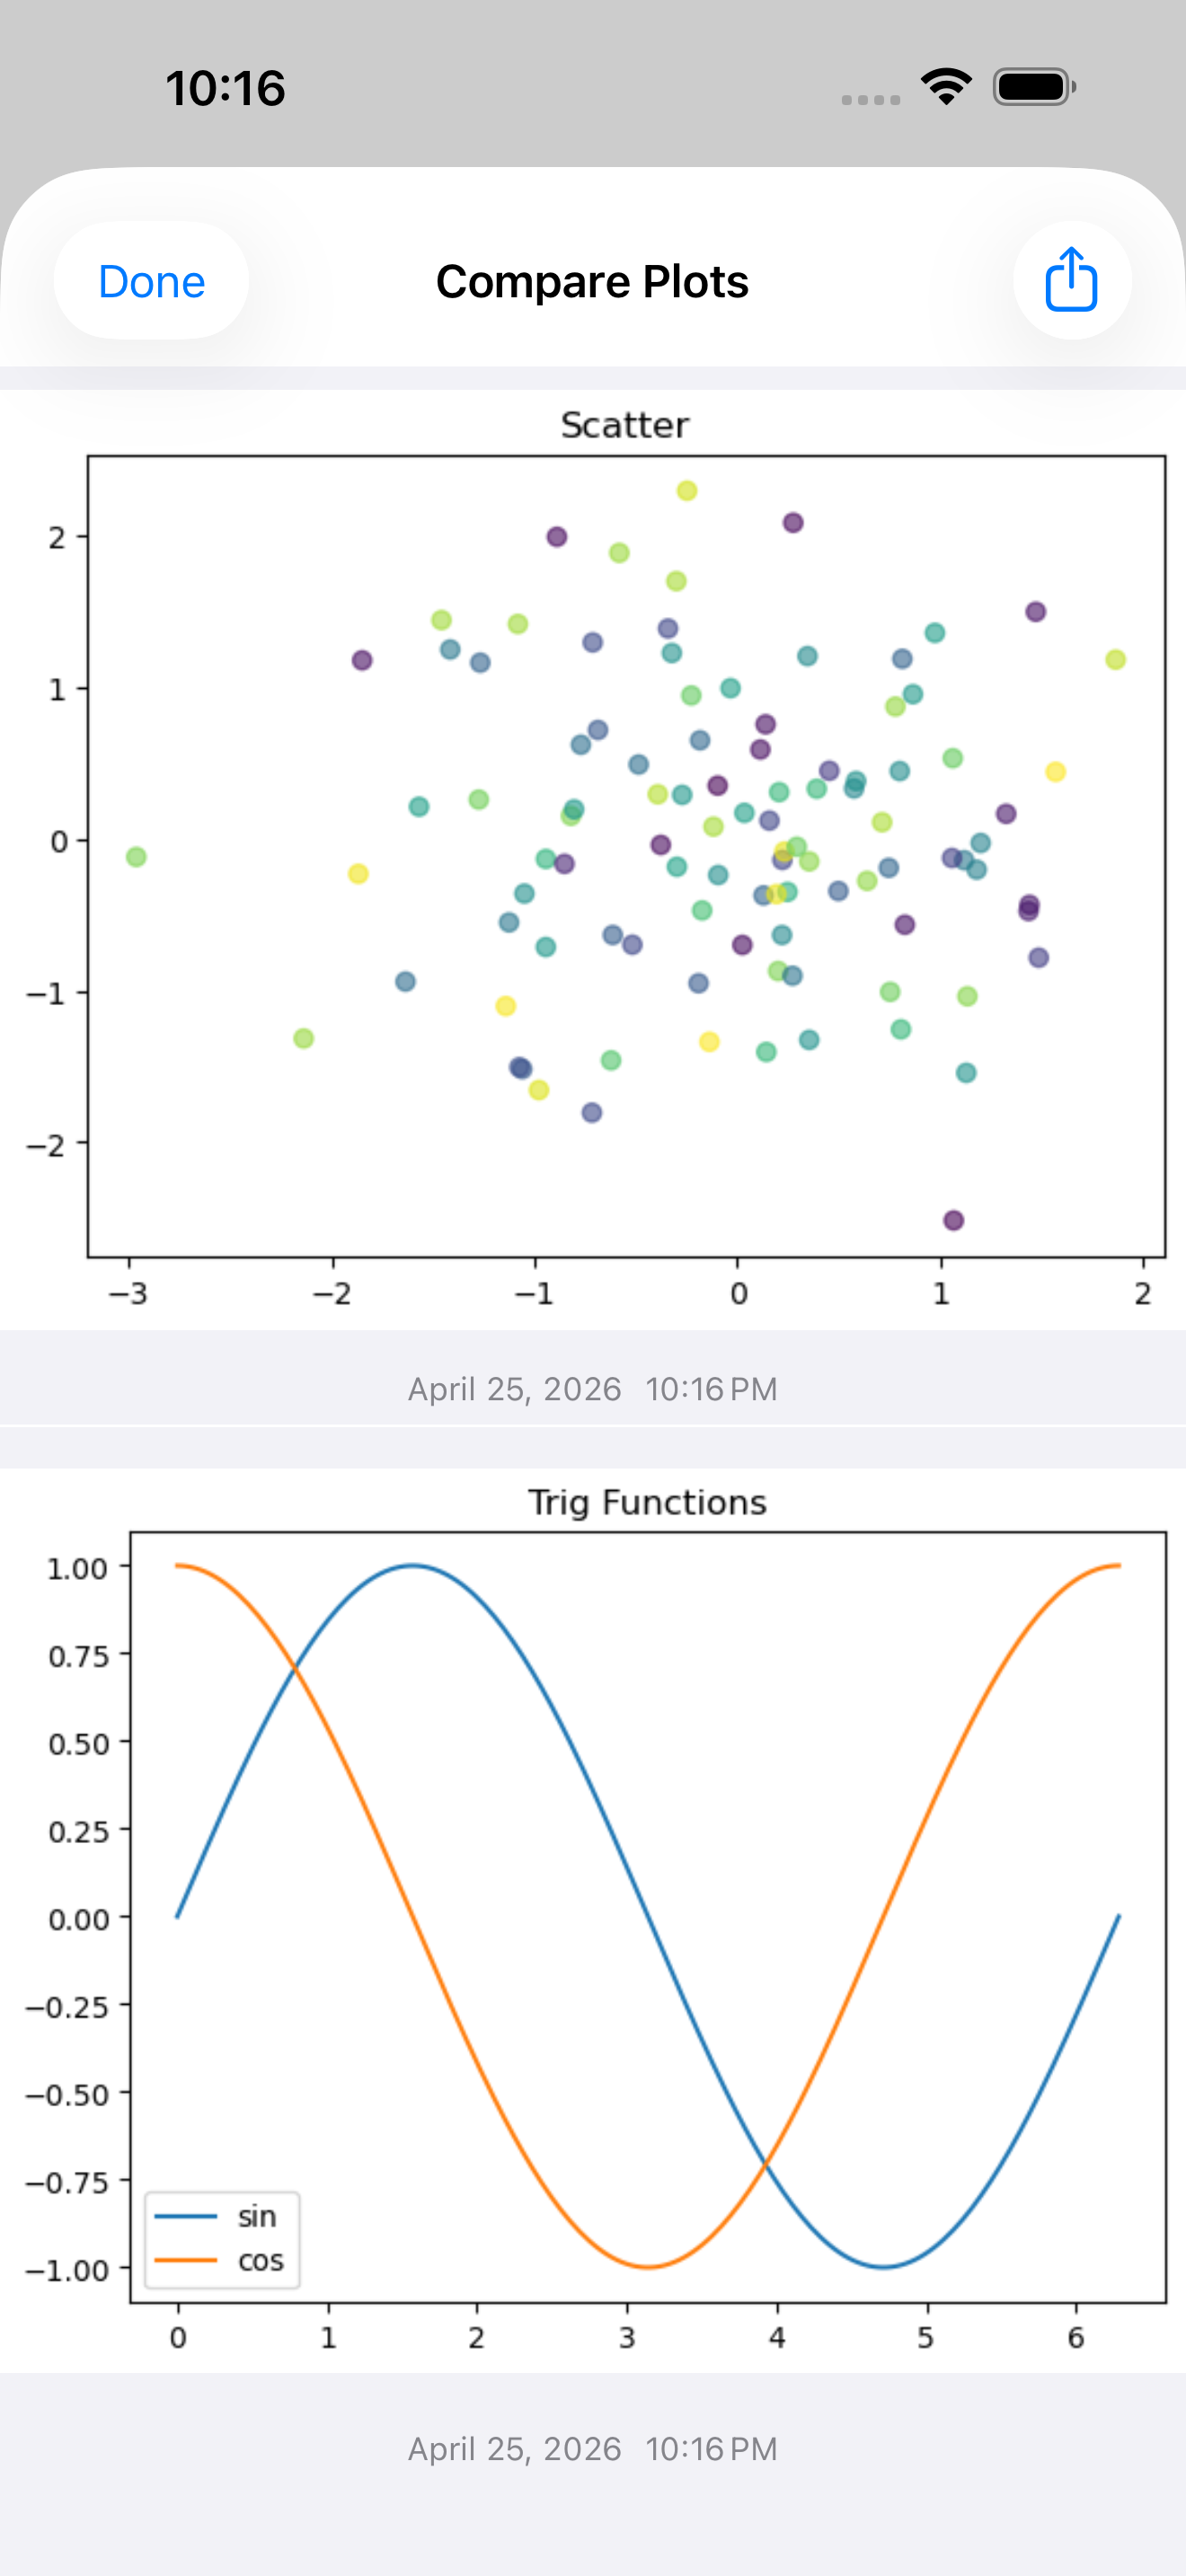
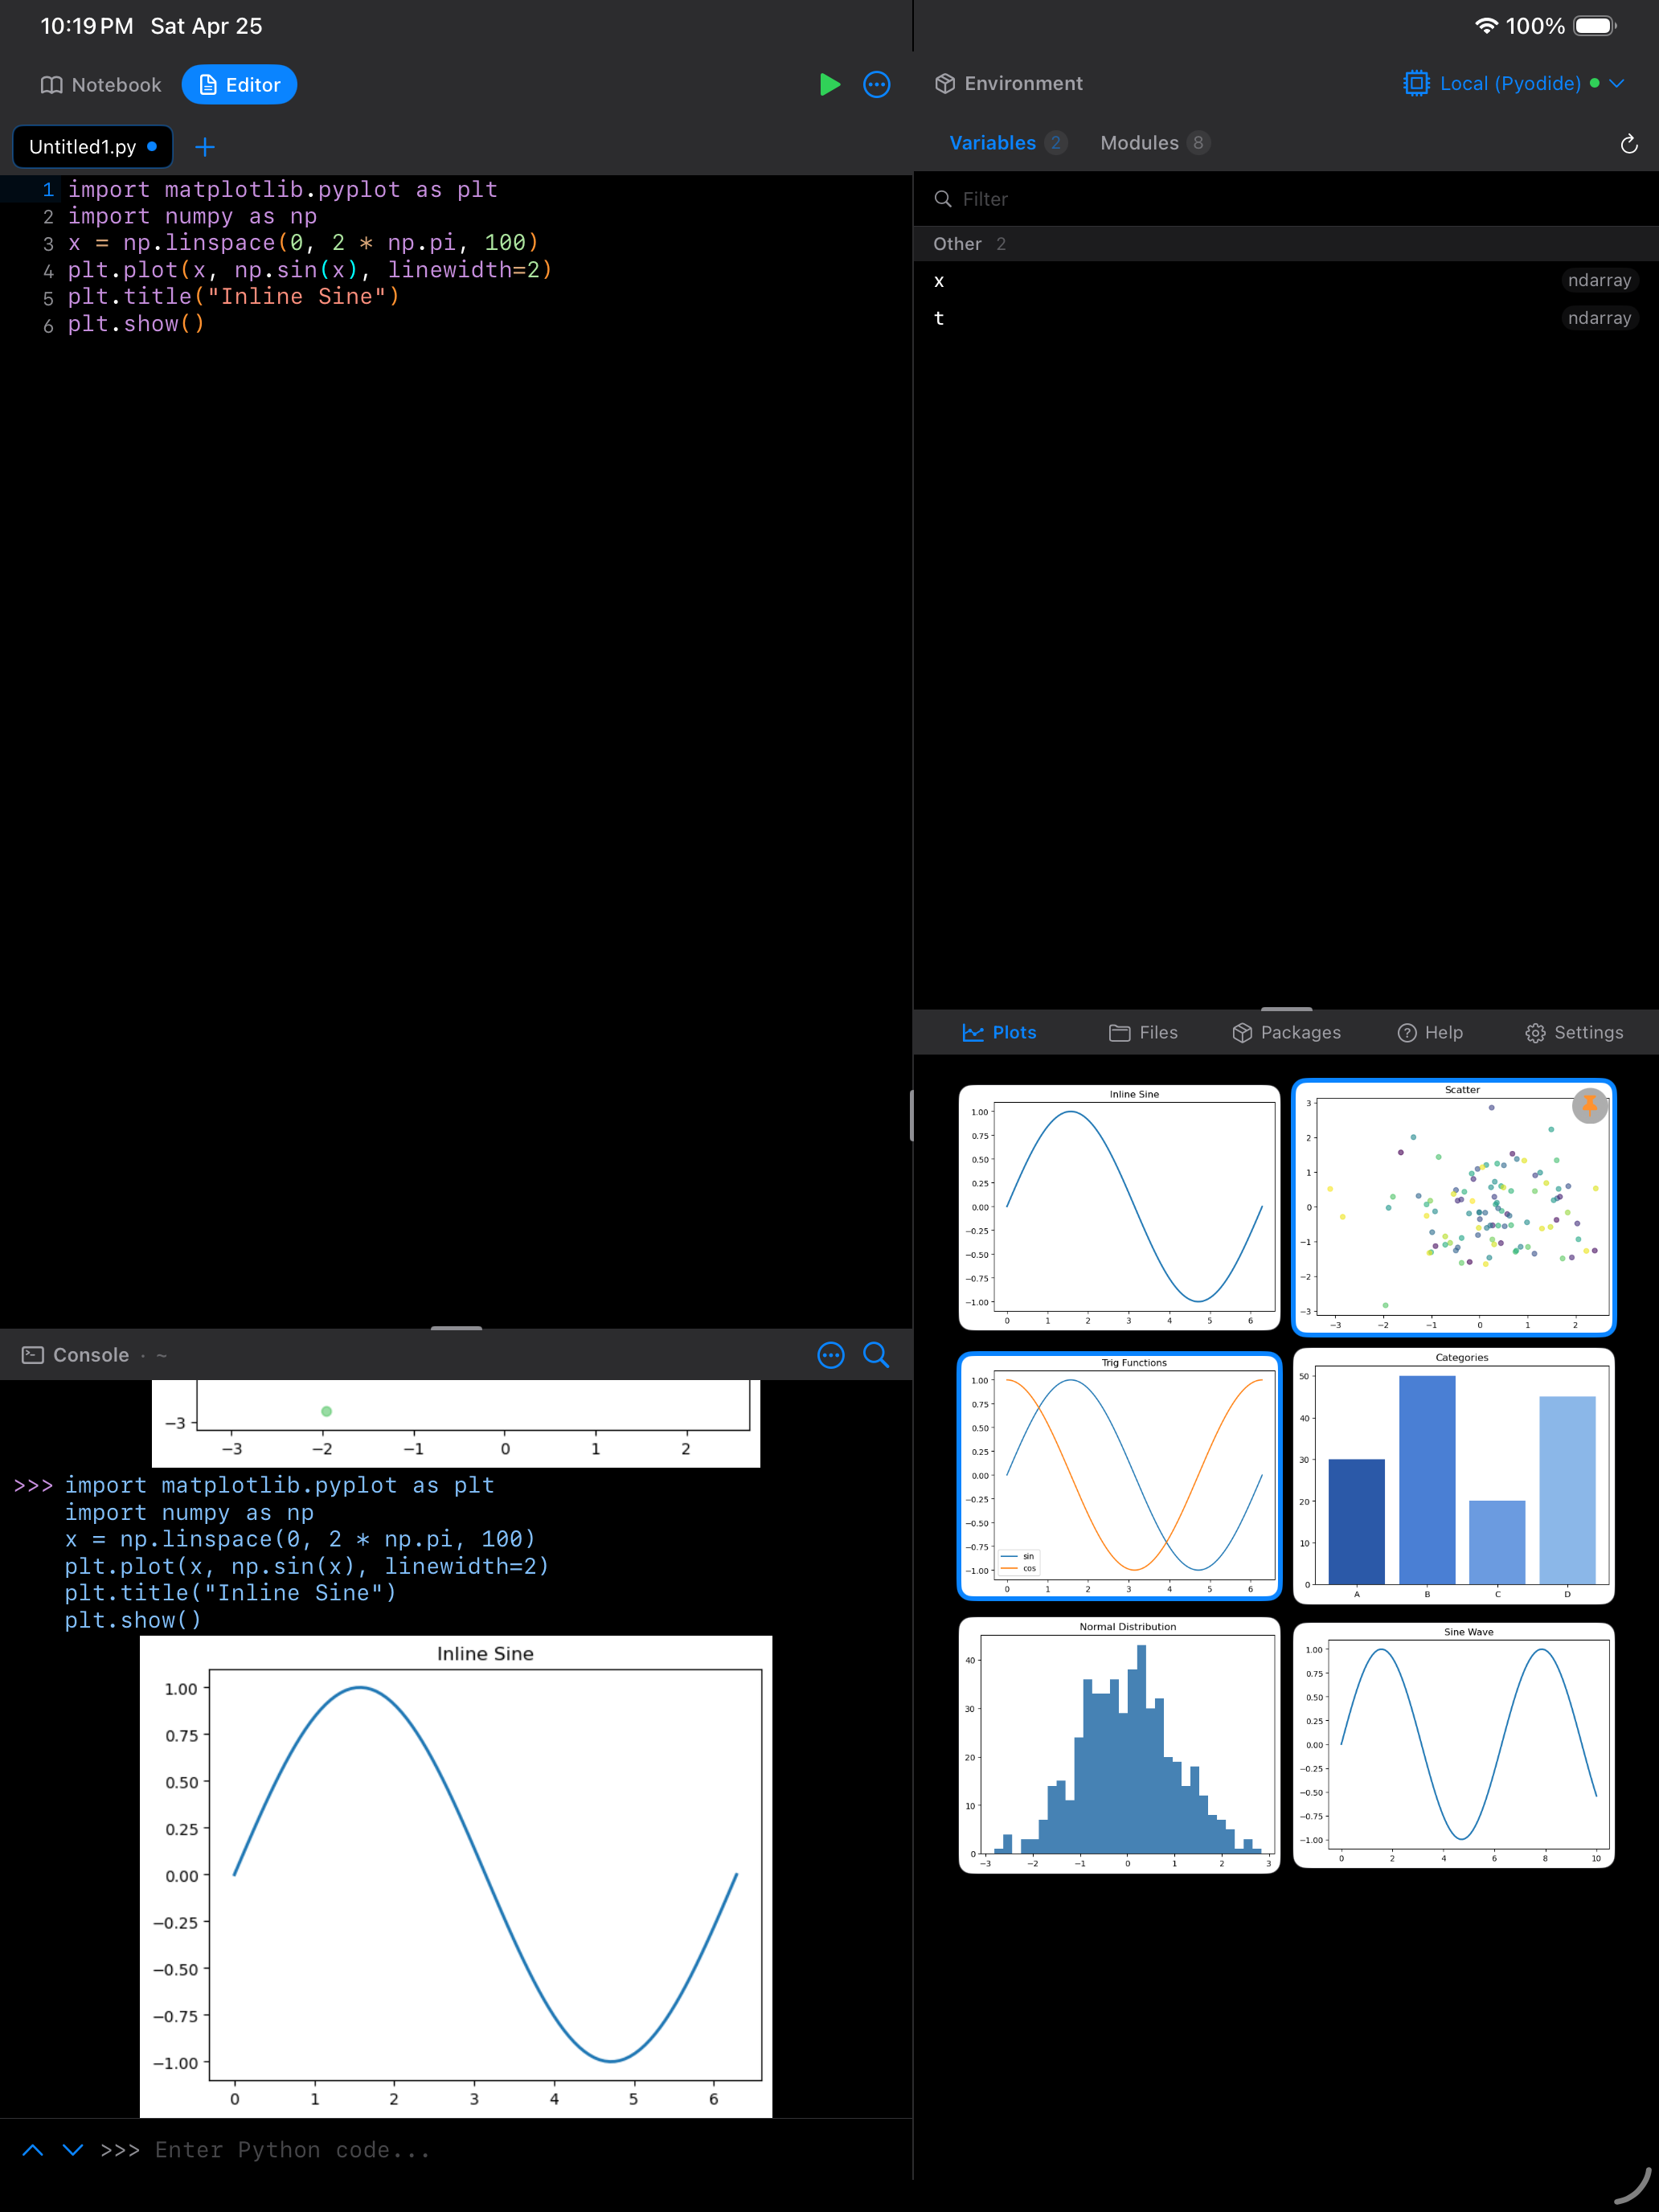
Plot Comparison
When you have two or more plots, you can compare them side by side. This is especially useful when you are iterating on a visualization and want to see how your changes look next to the previous version.
To start a comparison:
- Tap Compare in the toolbar (it appears when you have at least two plots)
- Tap the two plots you want to compare. They get numbered badges showing which is “Plot 1” and “Plot 2”
- Tap View in the toolbar to open the comparison view
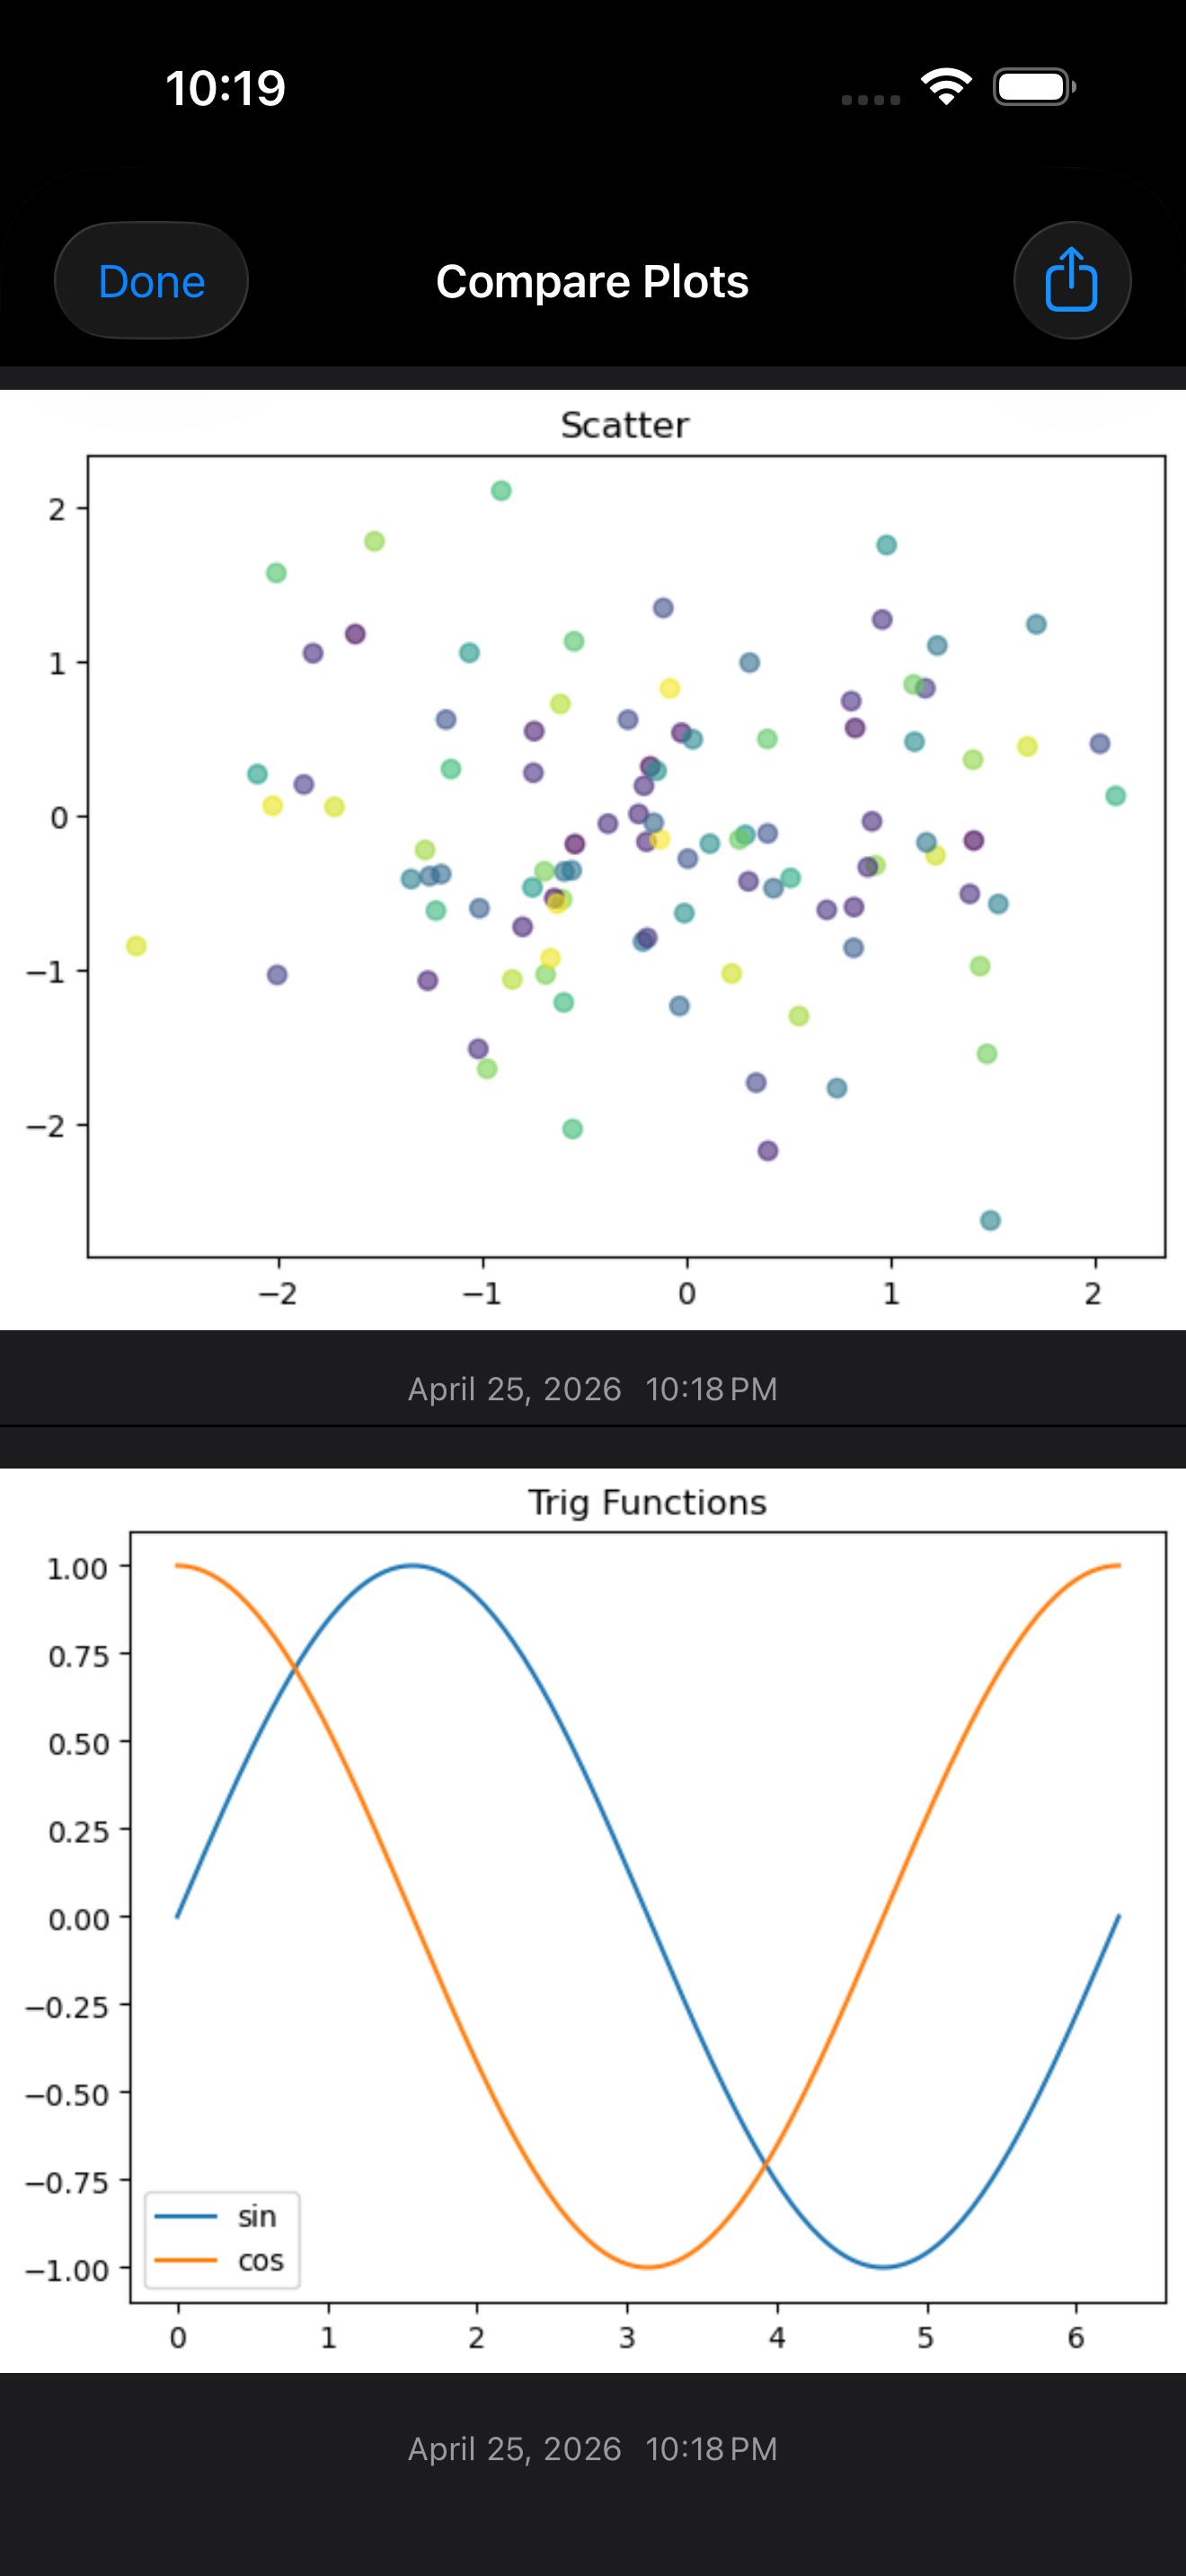
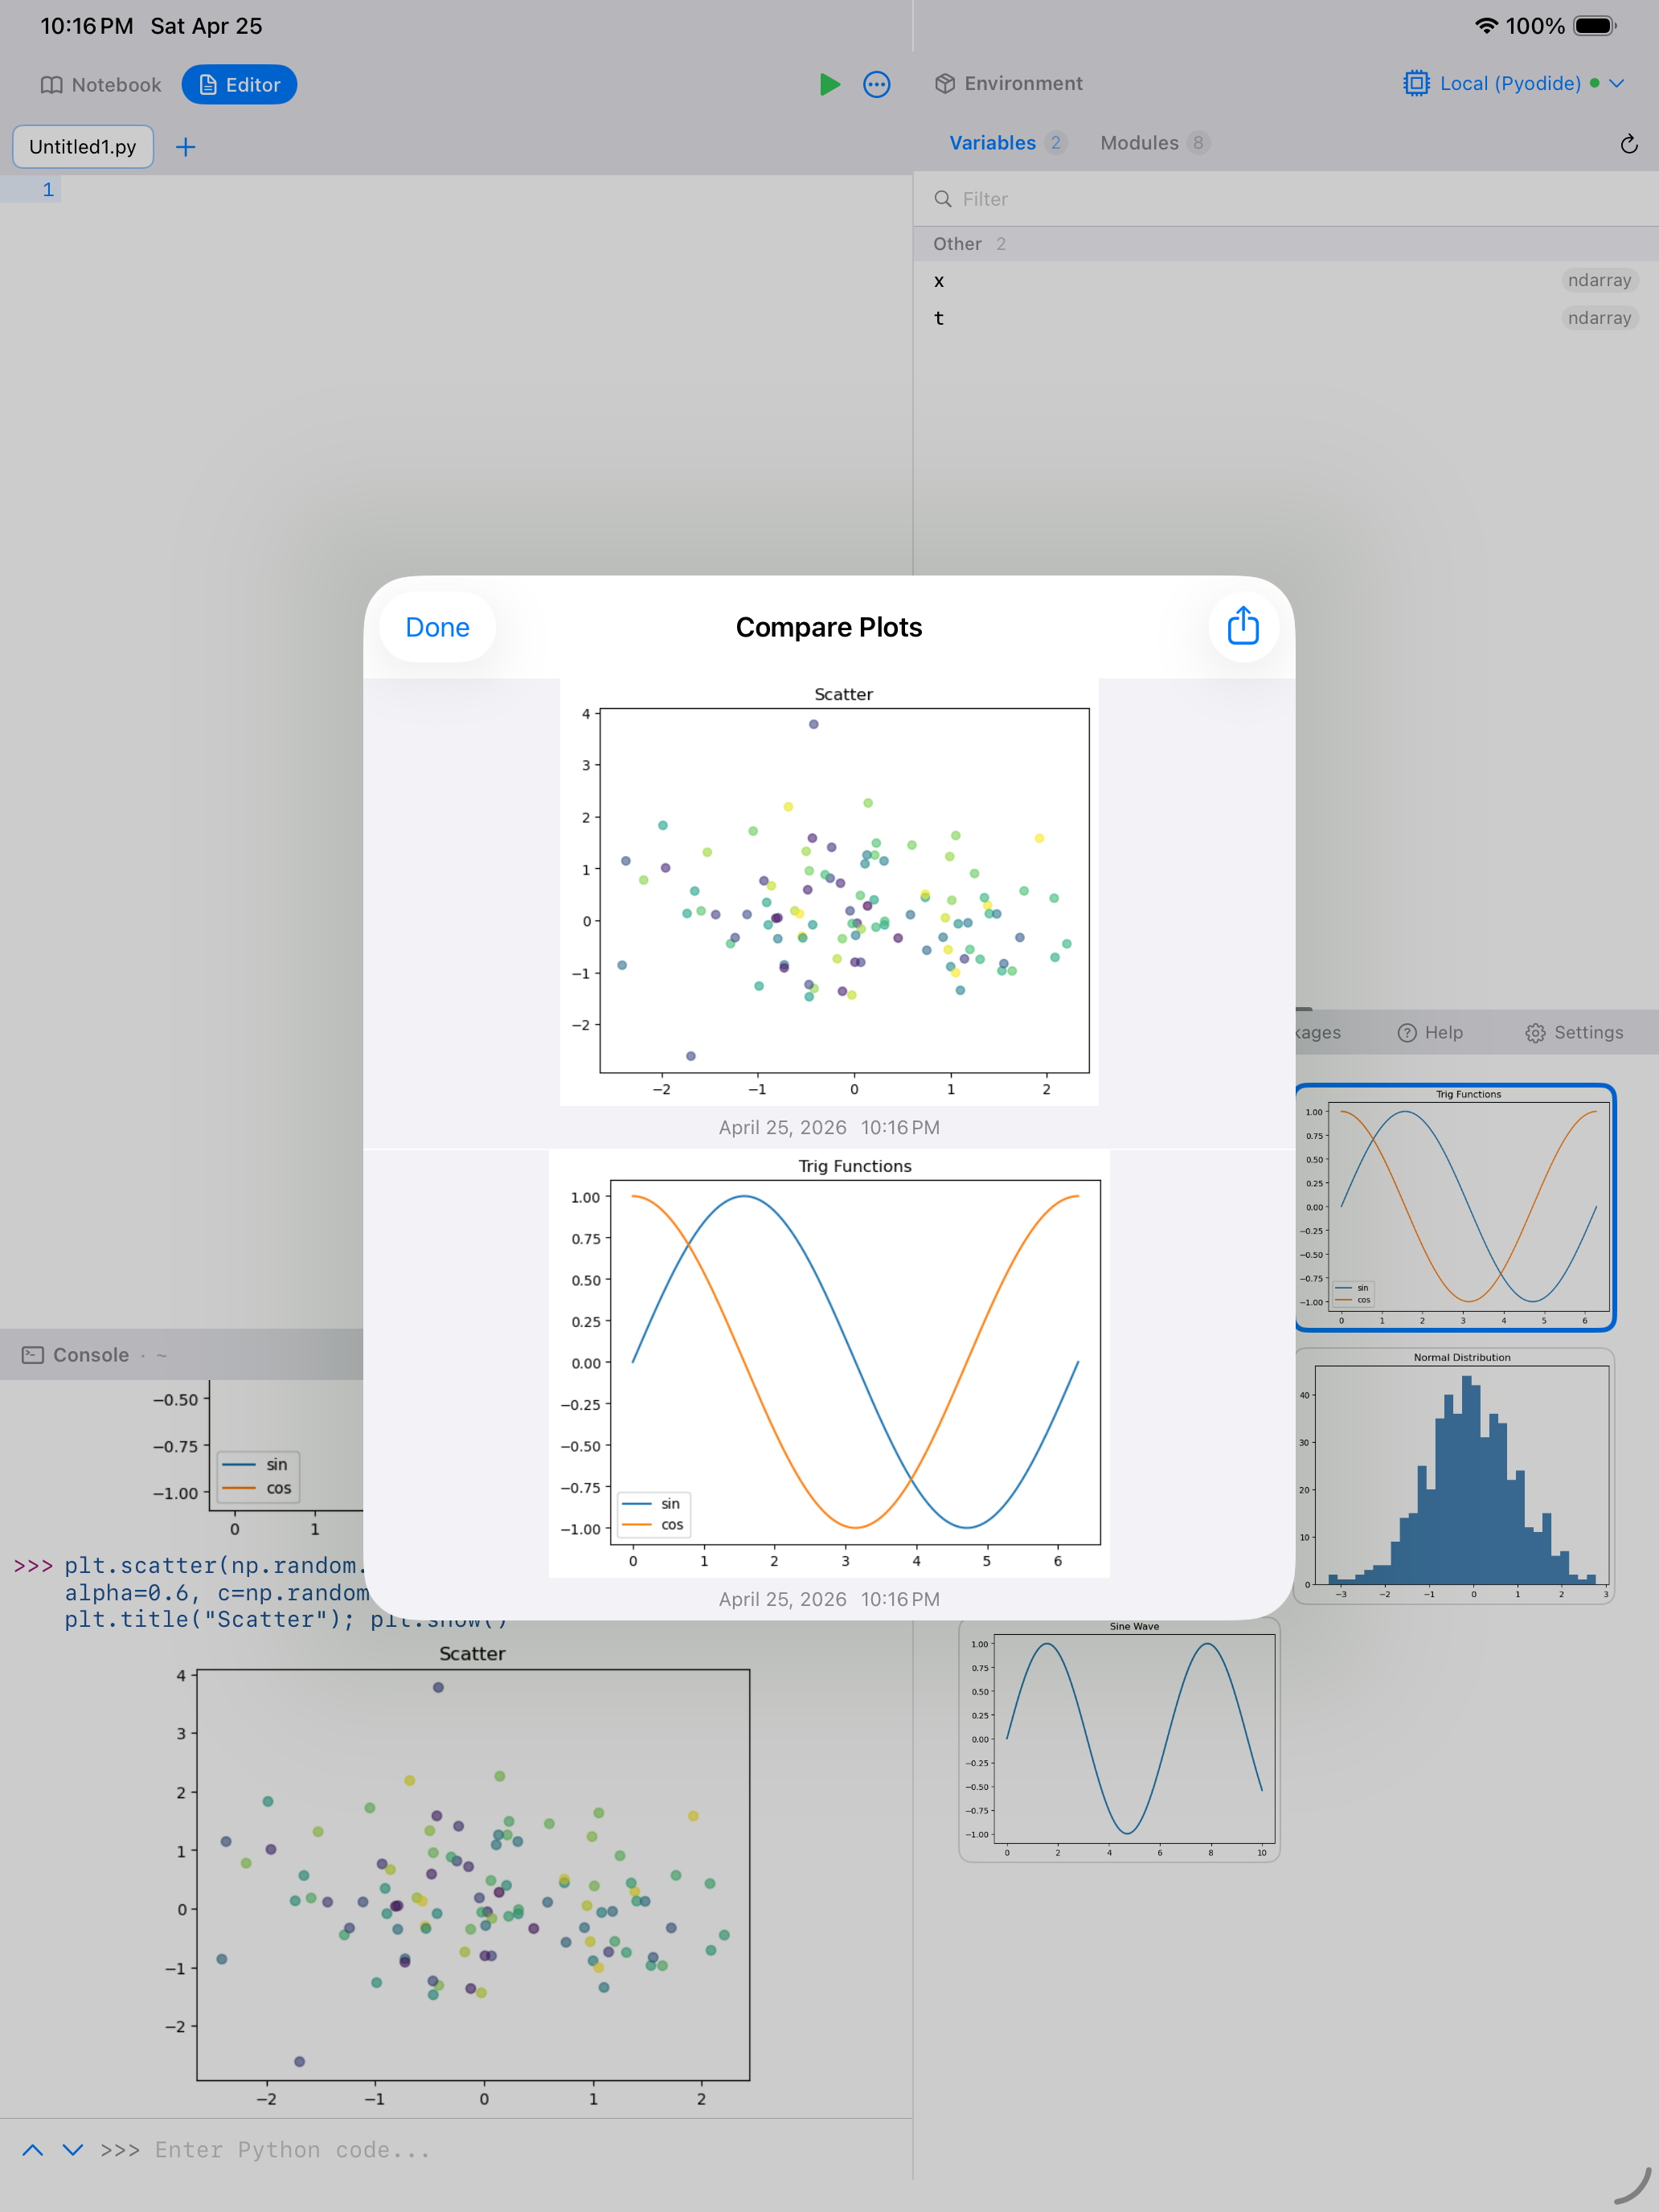
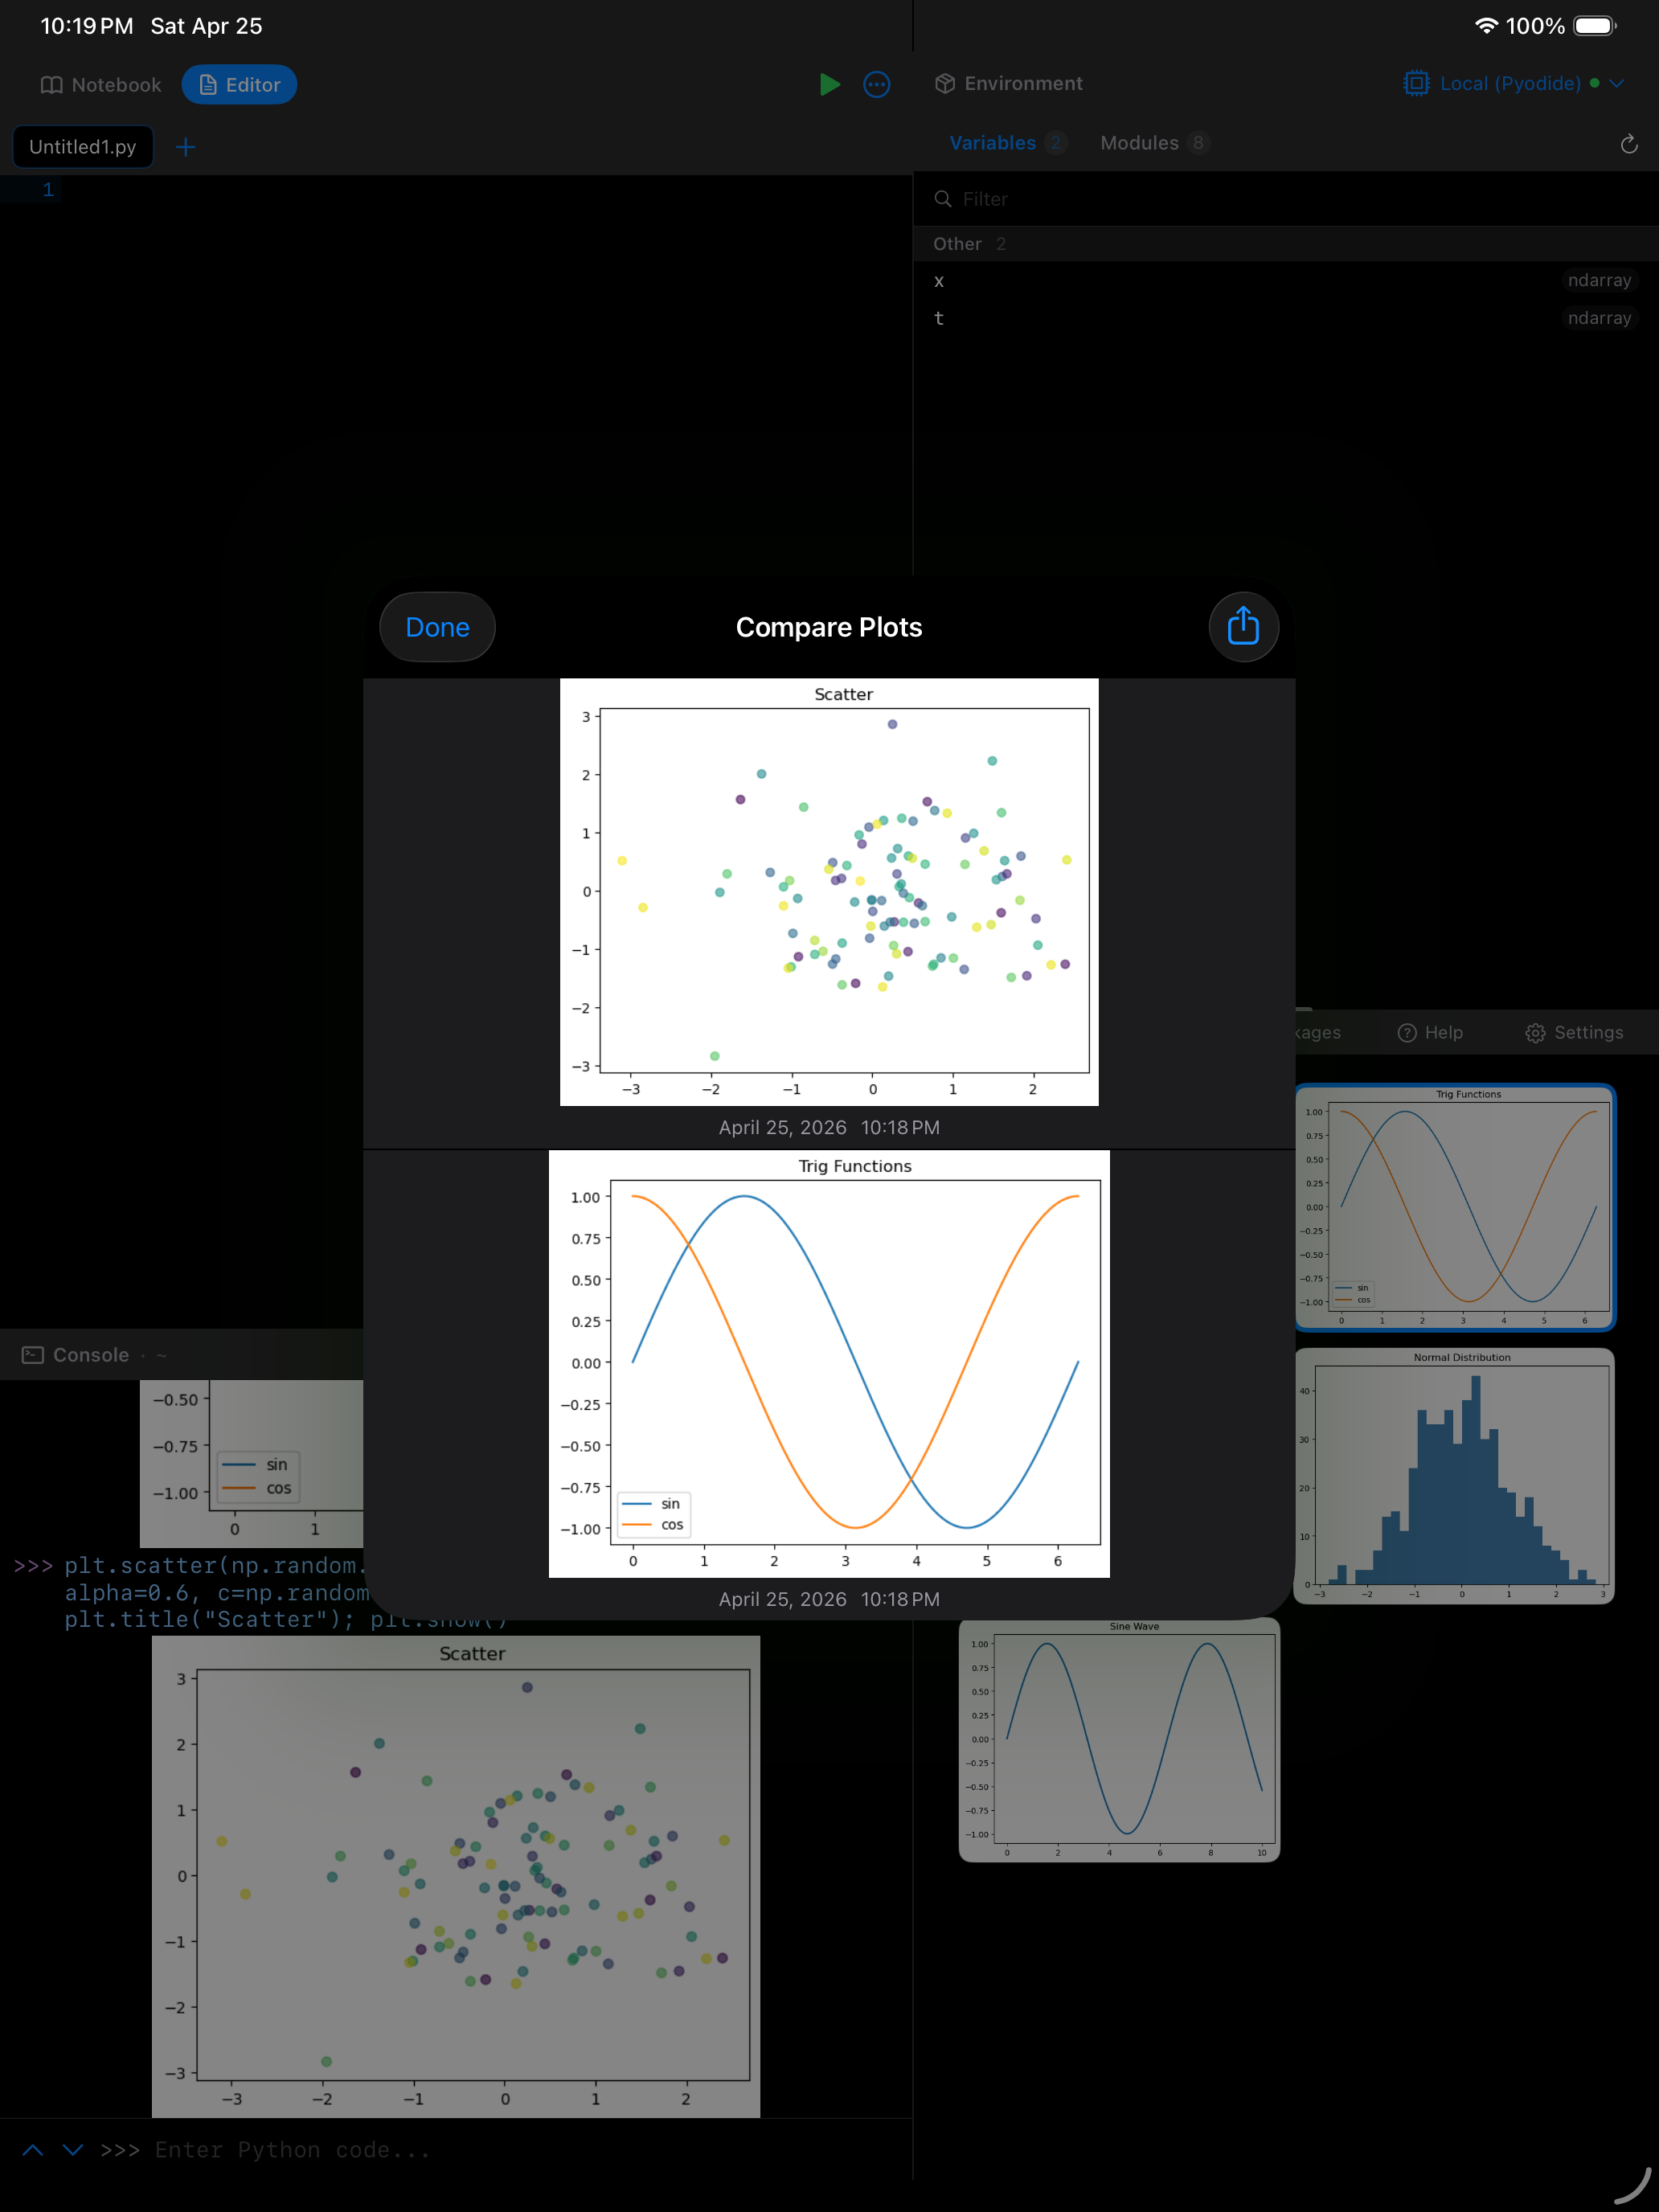
The comparison view shows both plots side by side on landscape or iPad, or stacked on portrait iPhone. You can pinch to zoom and pan both plots, and the sync zoom feature keeps them at the same zoom level and position by default so you can compare corresponding areas.
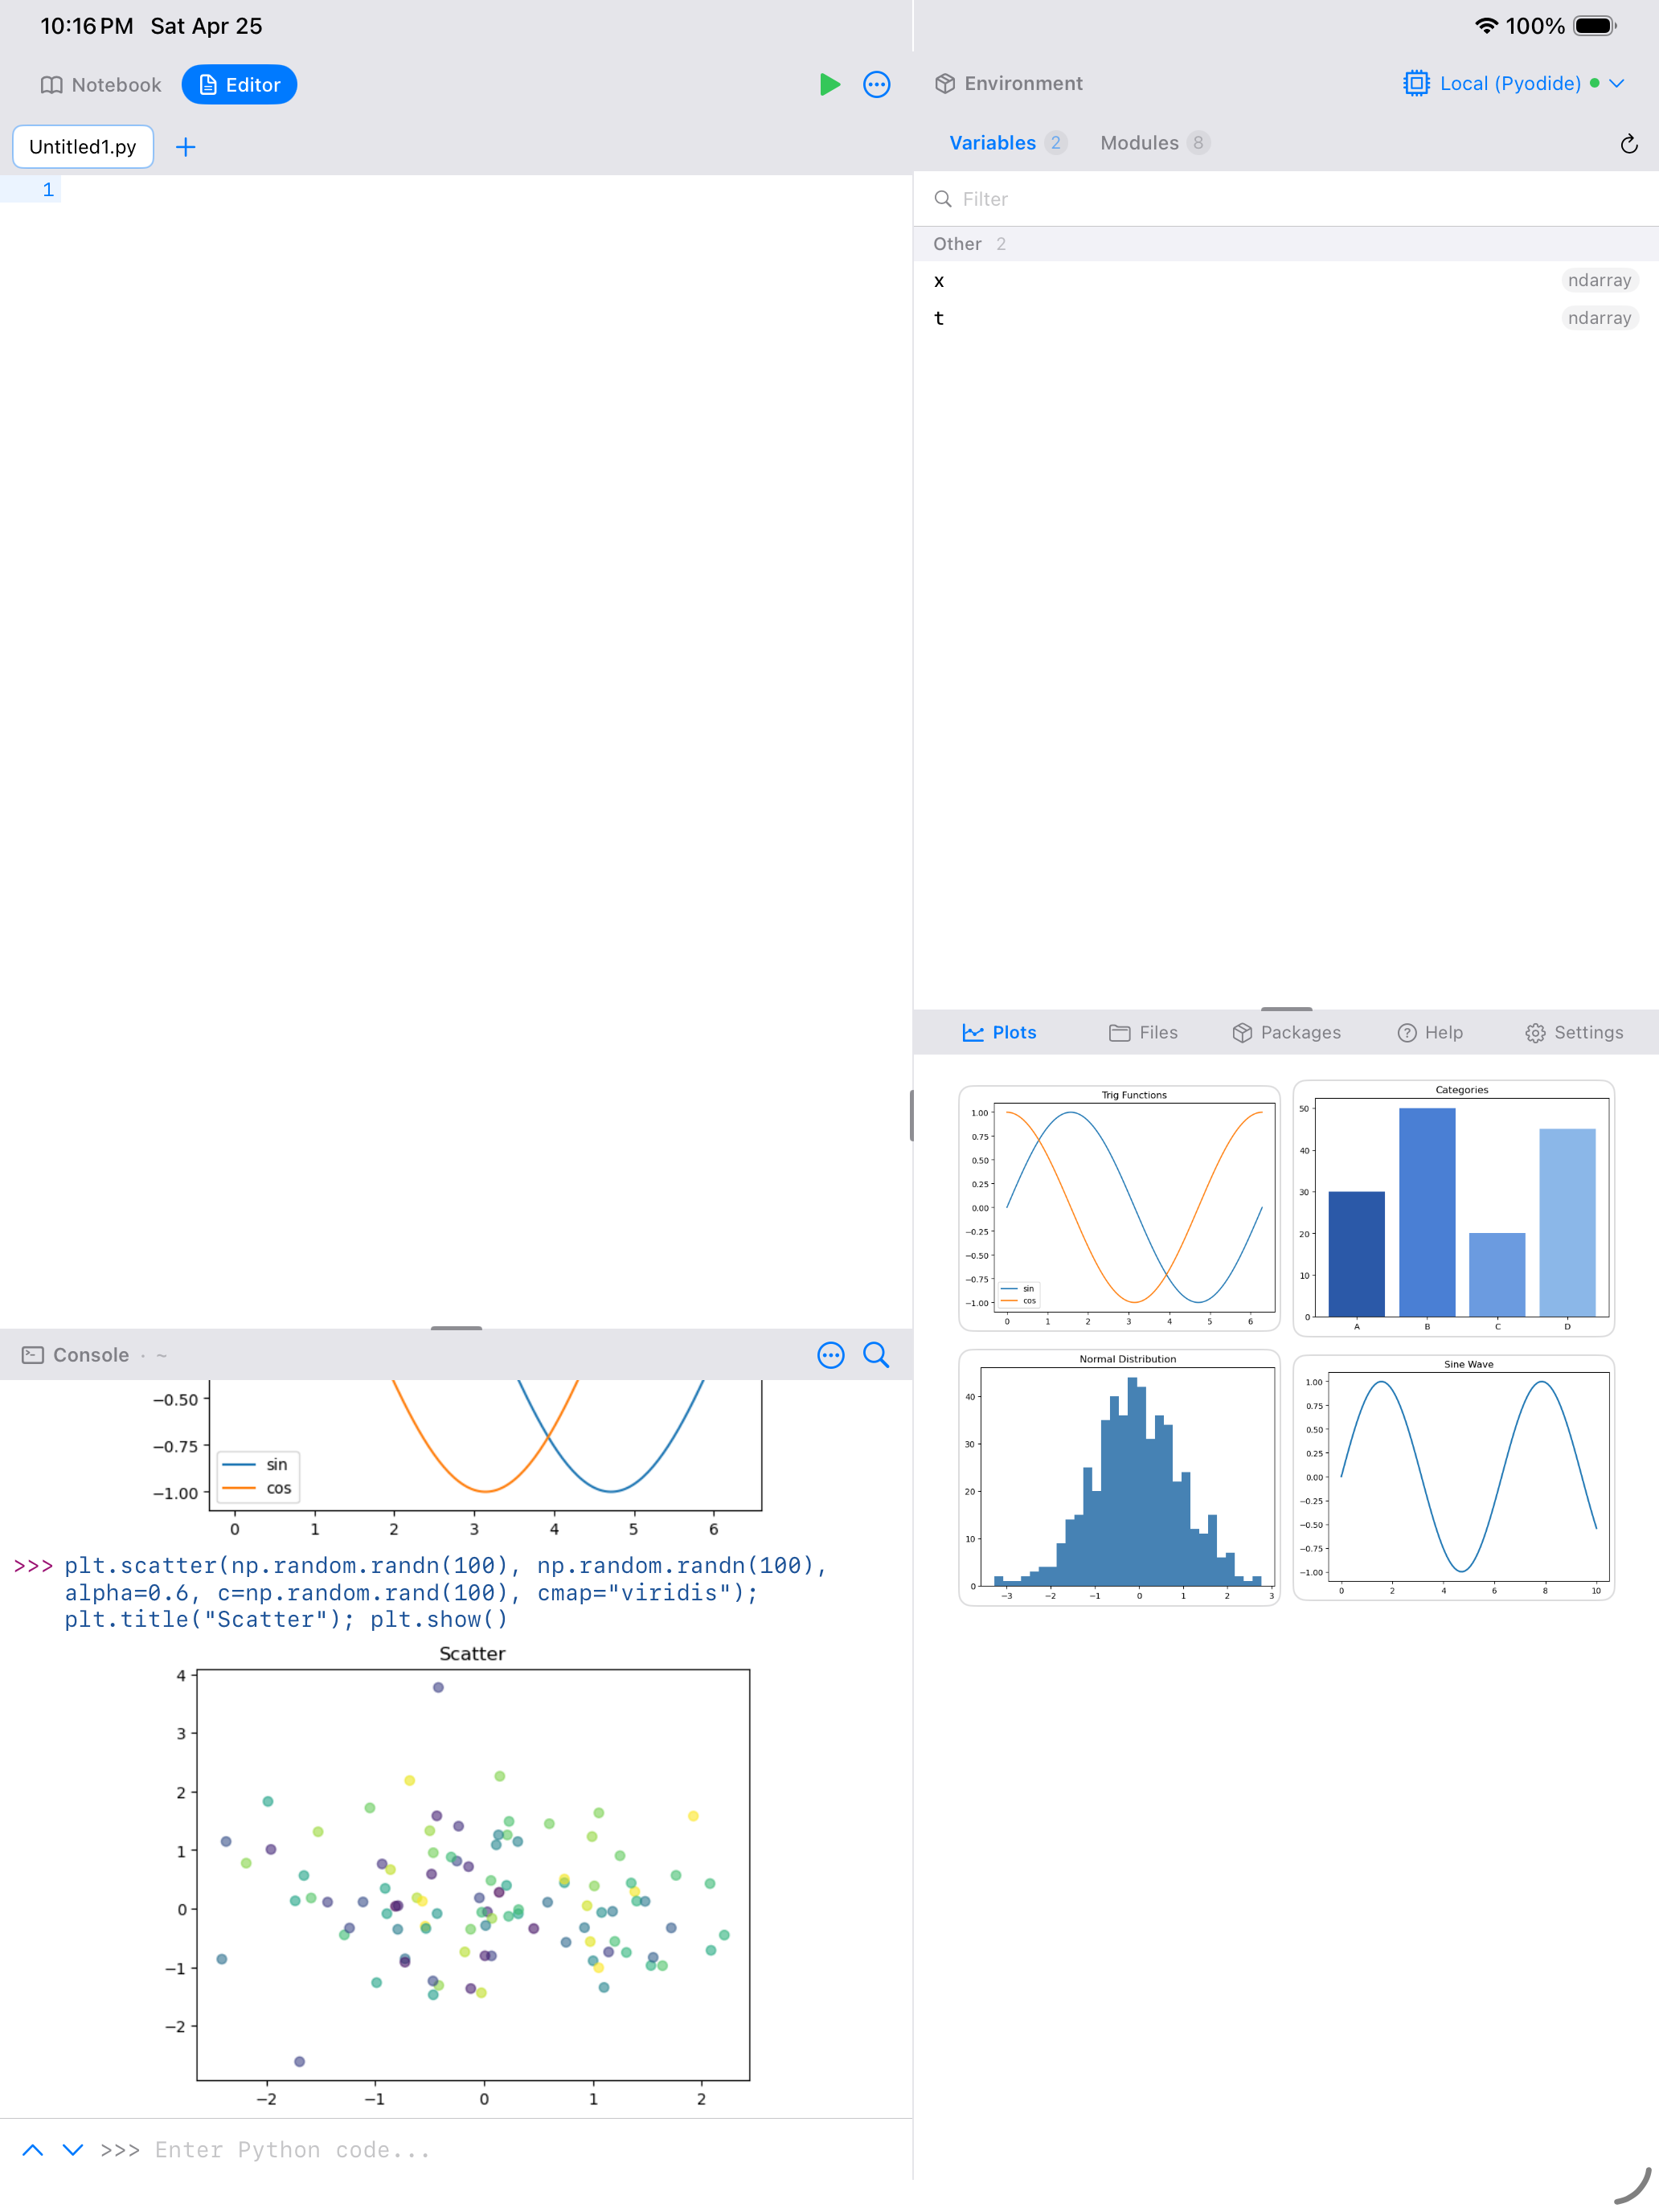
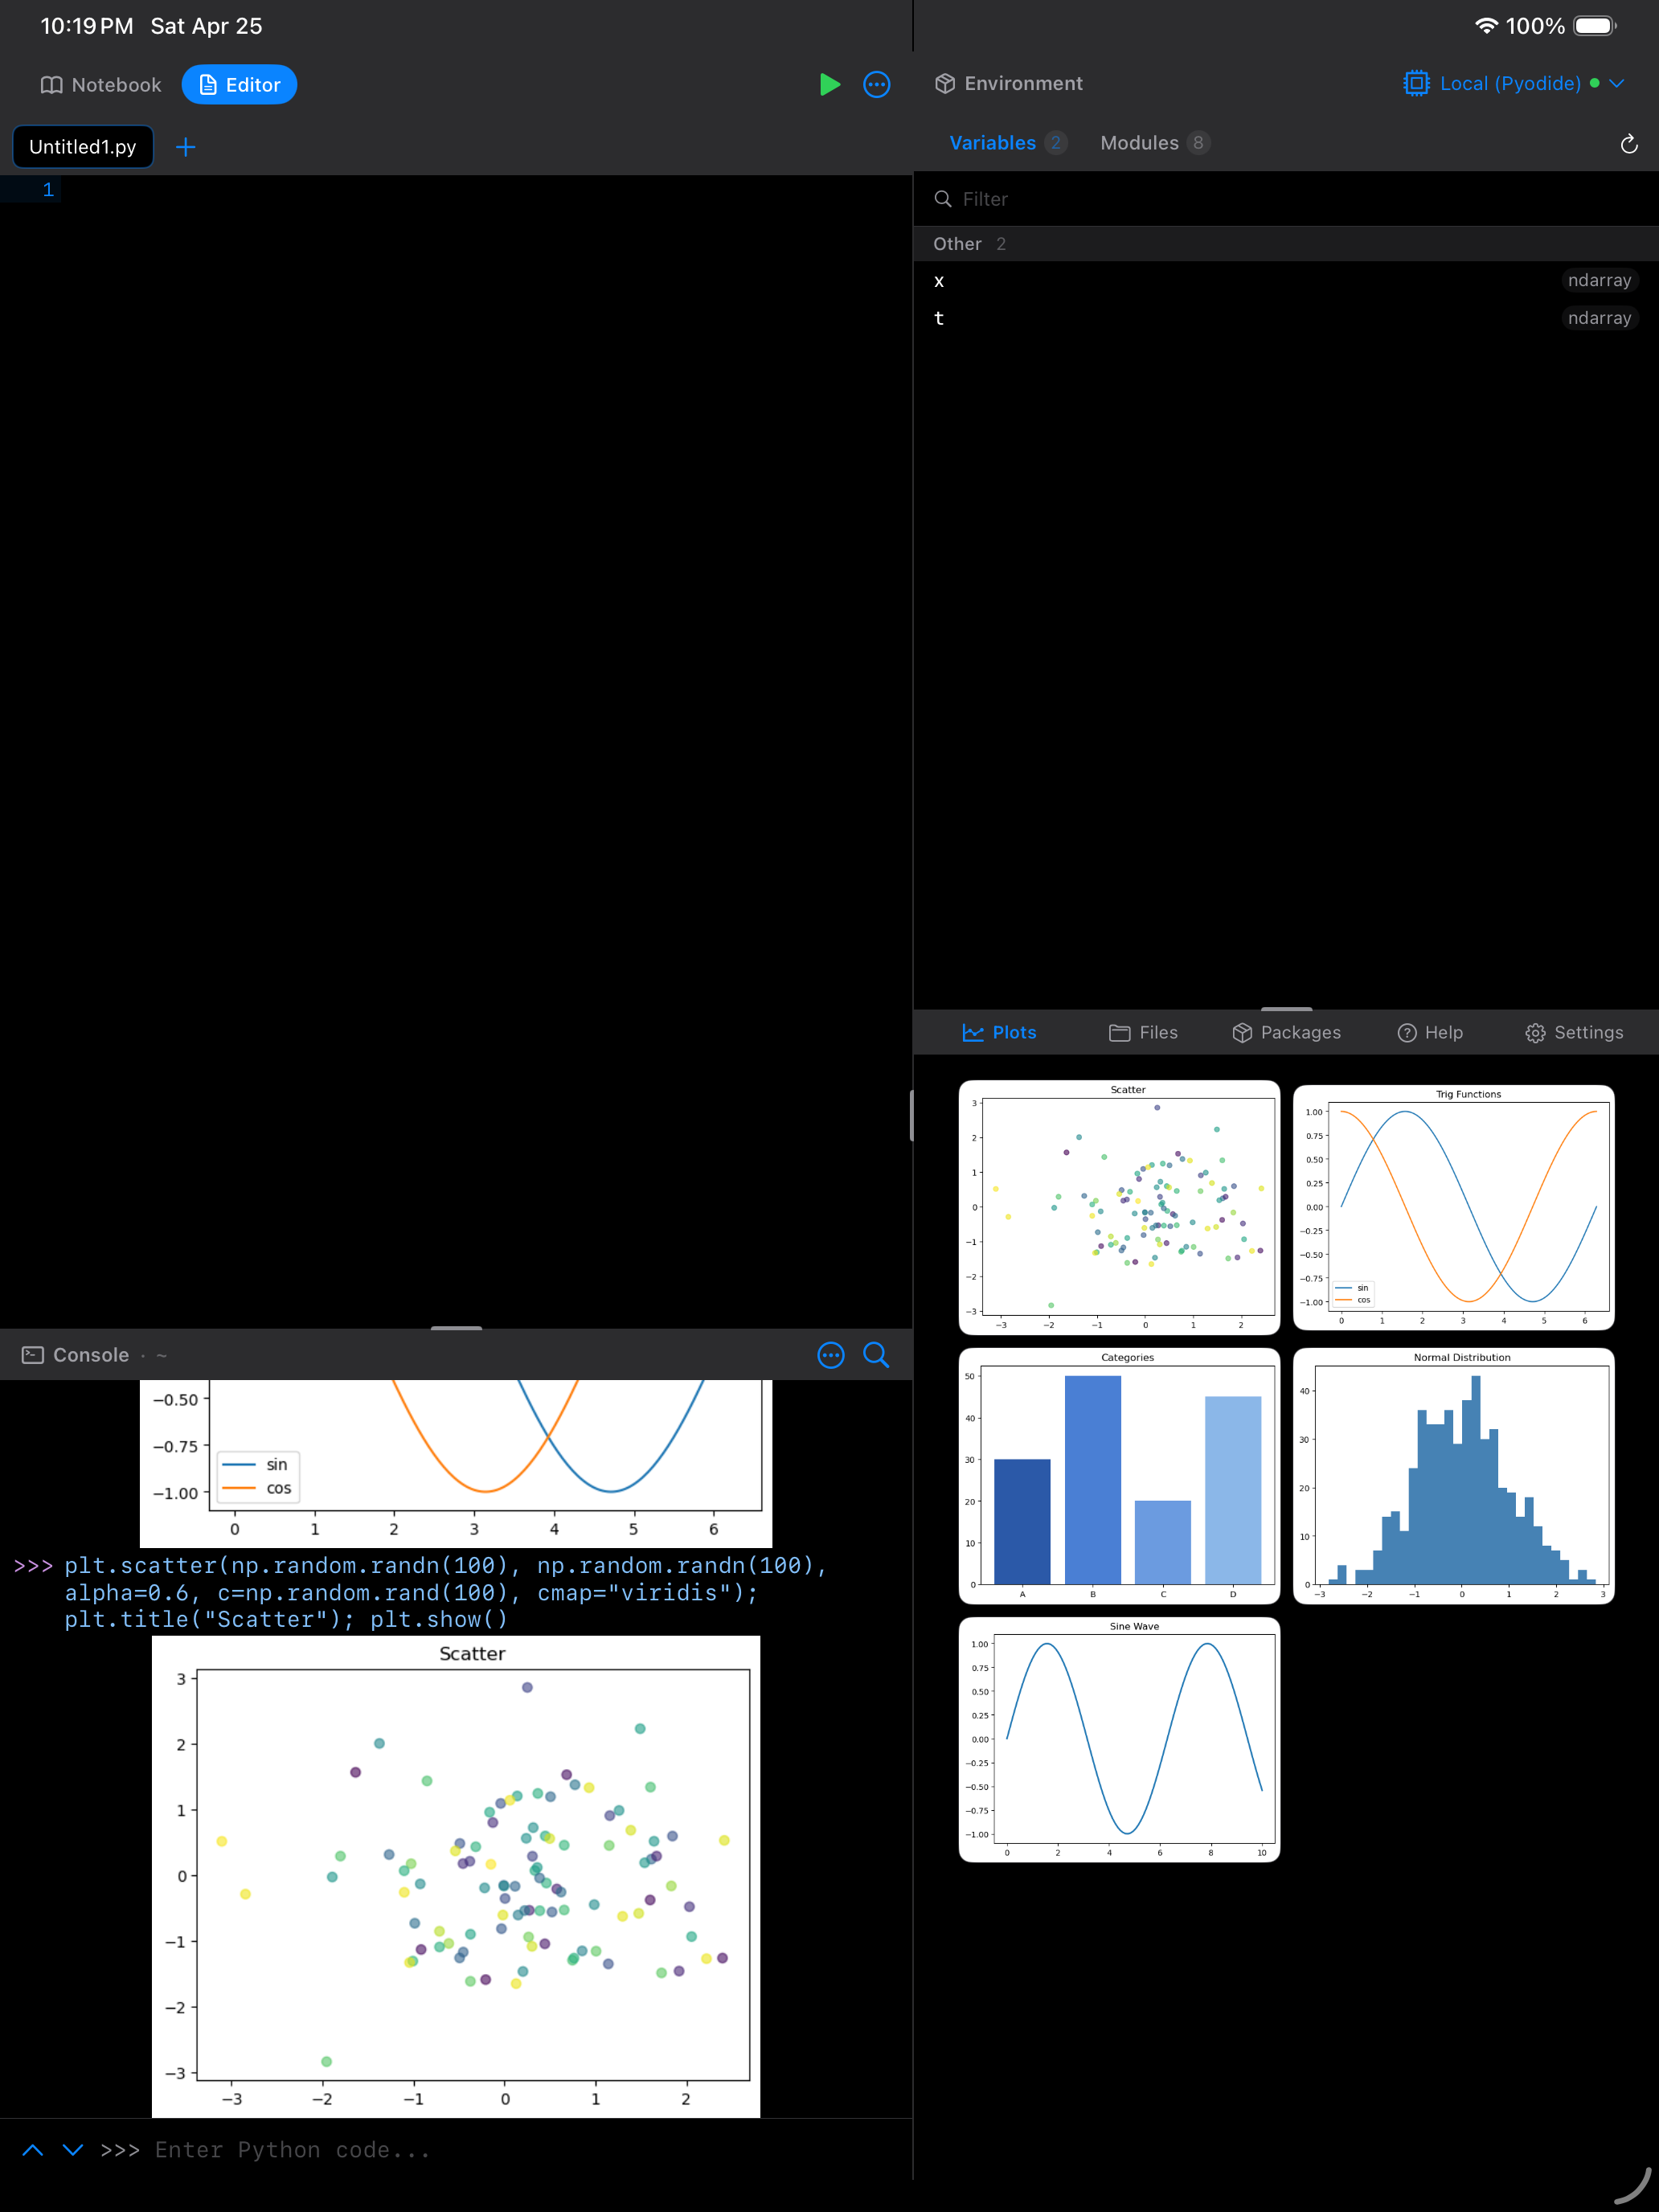
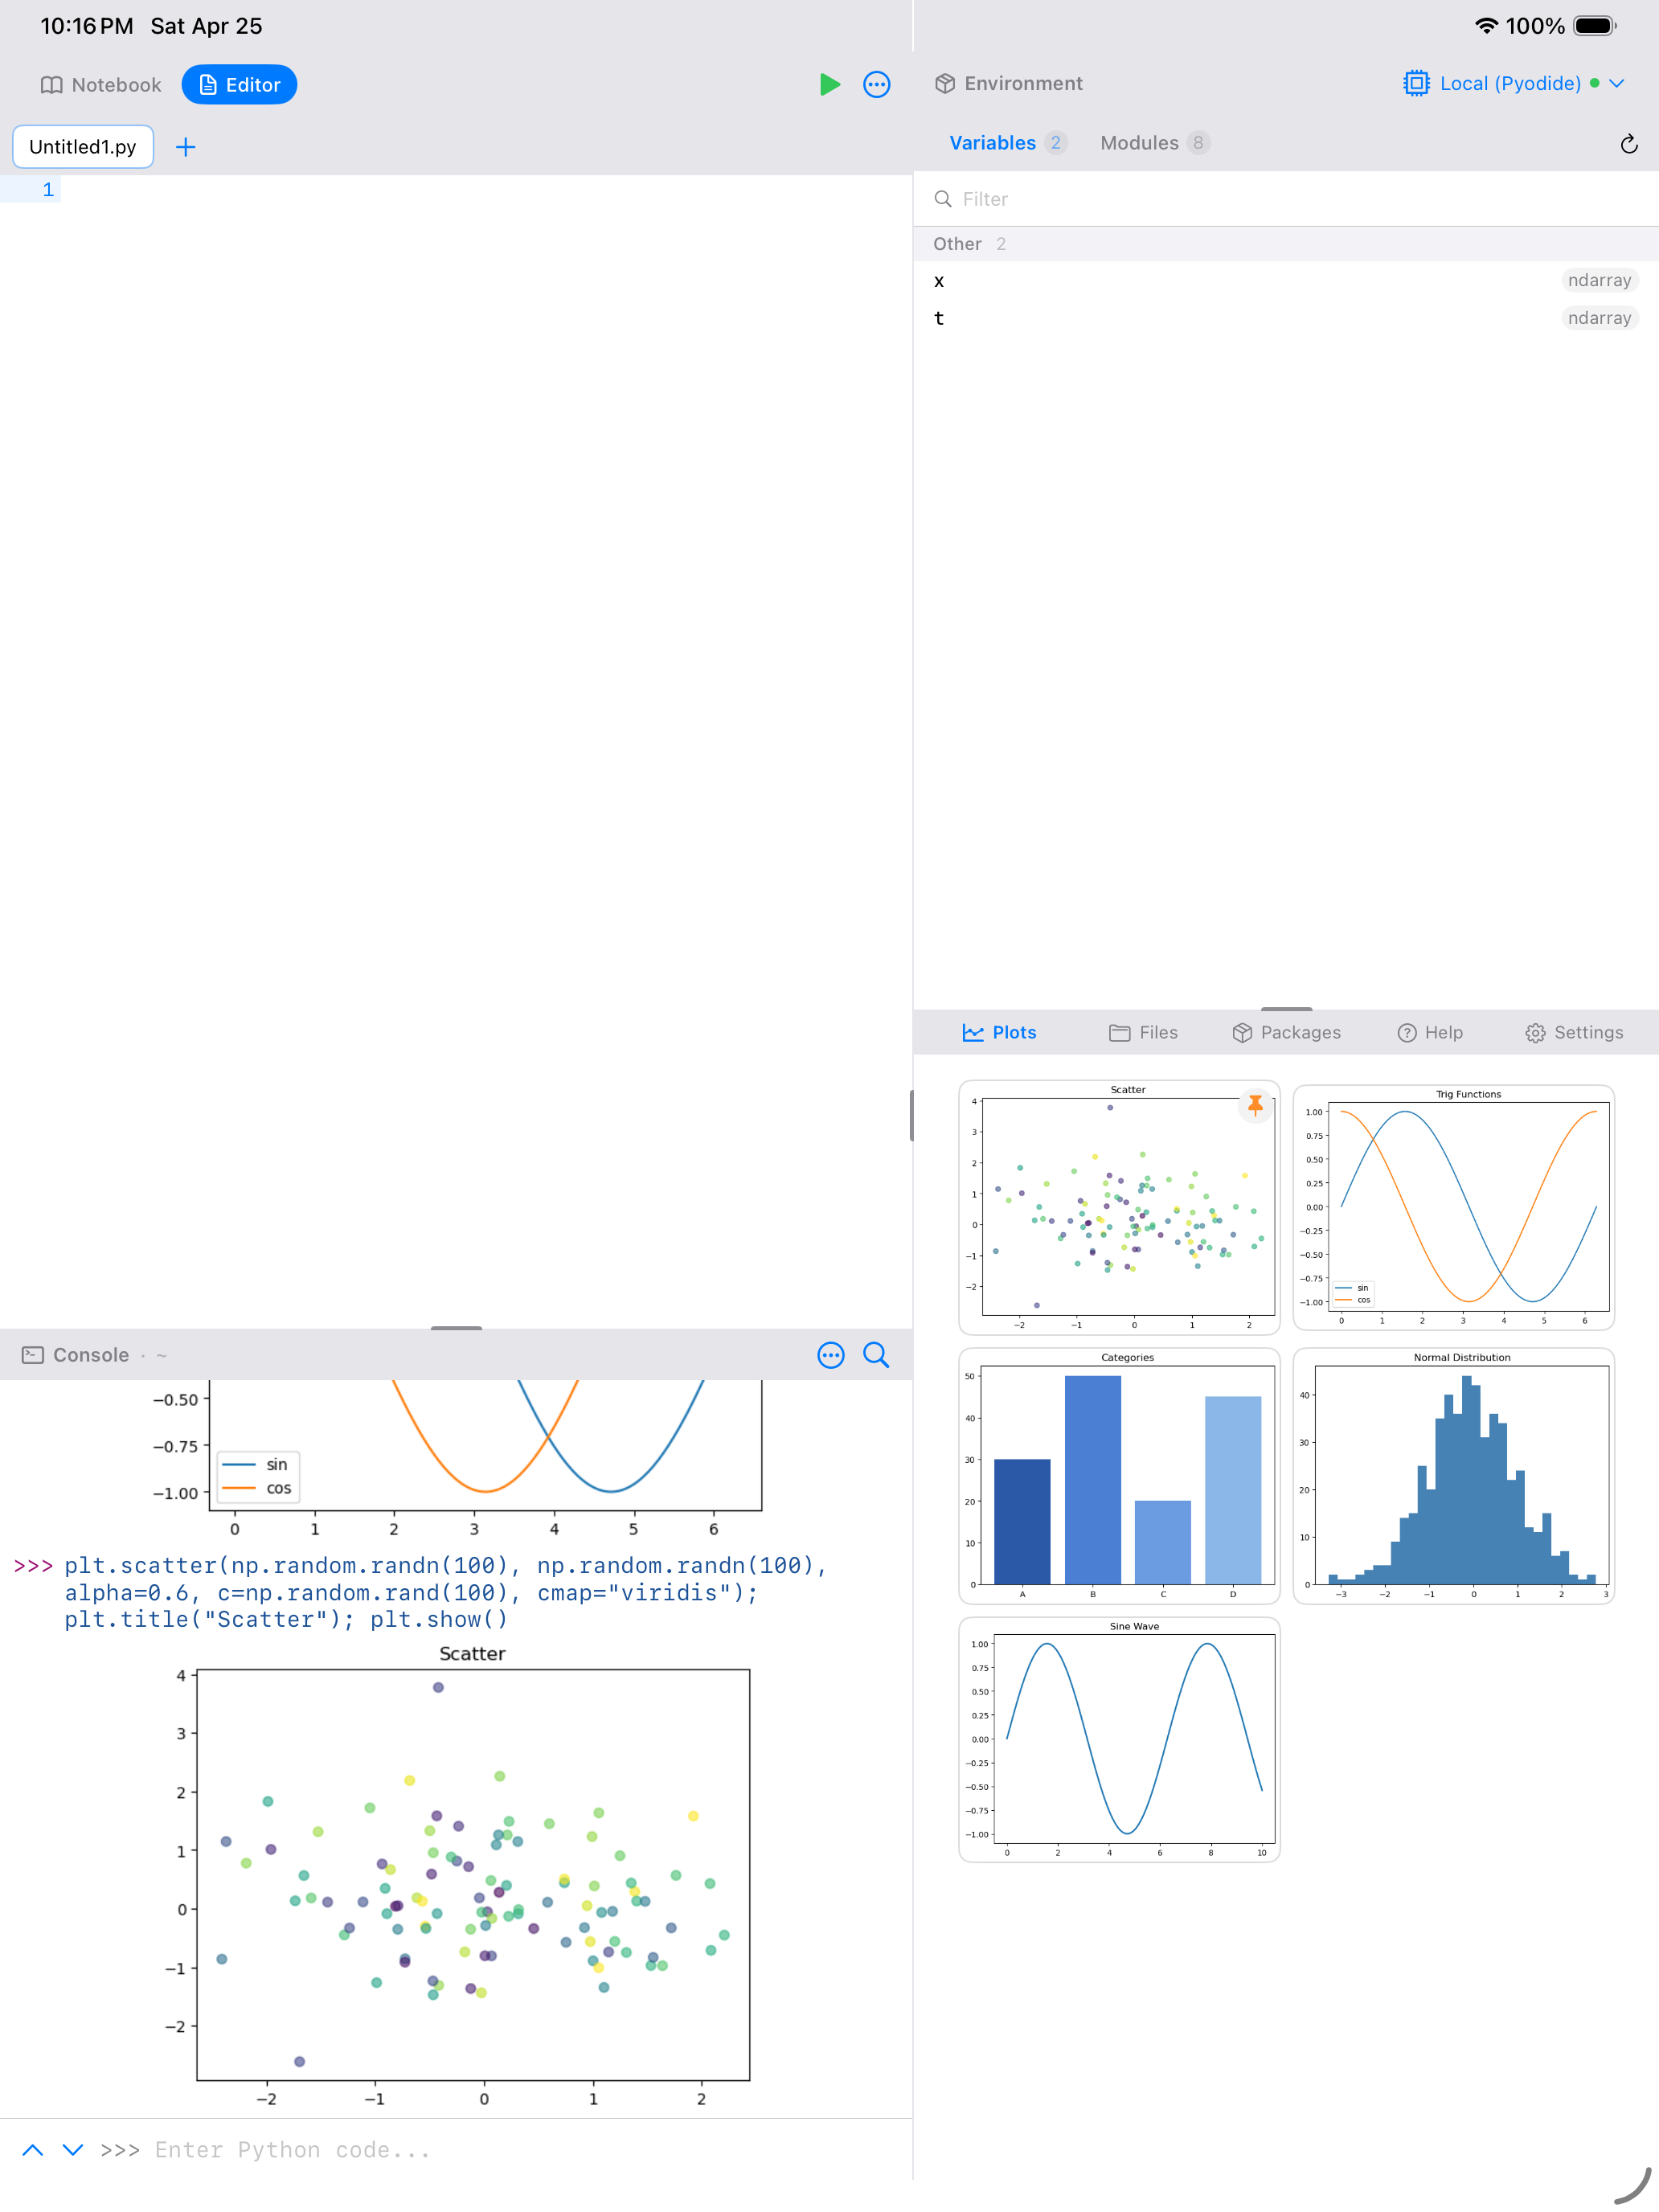
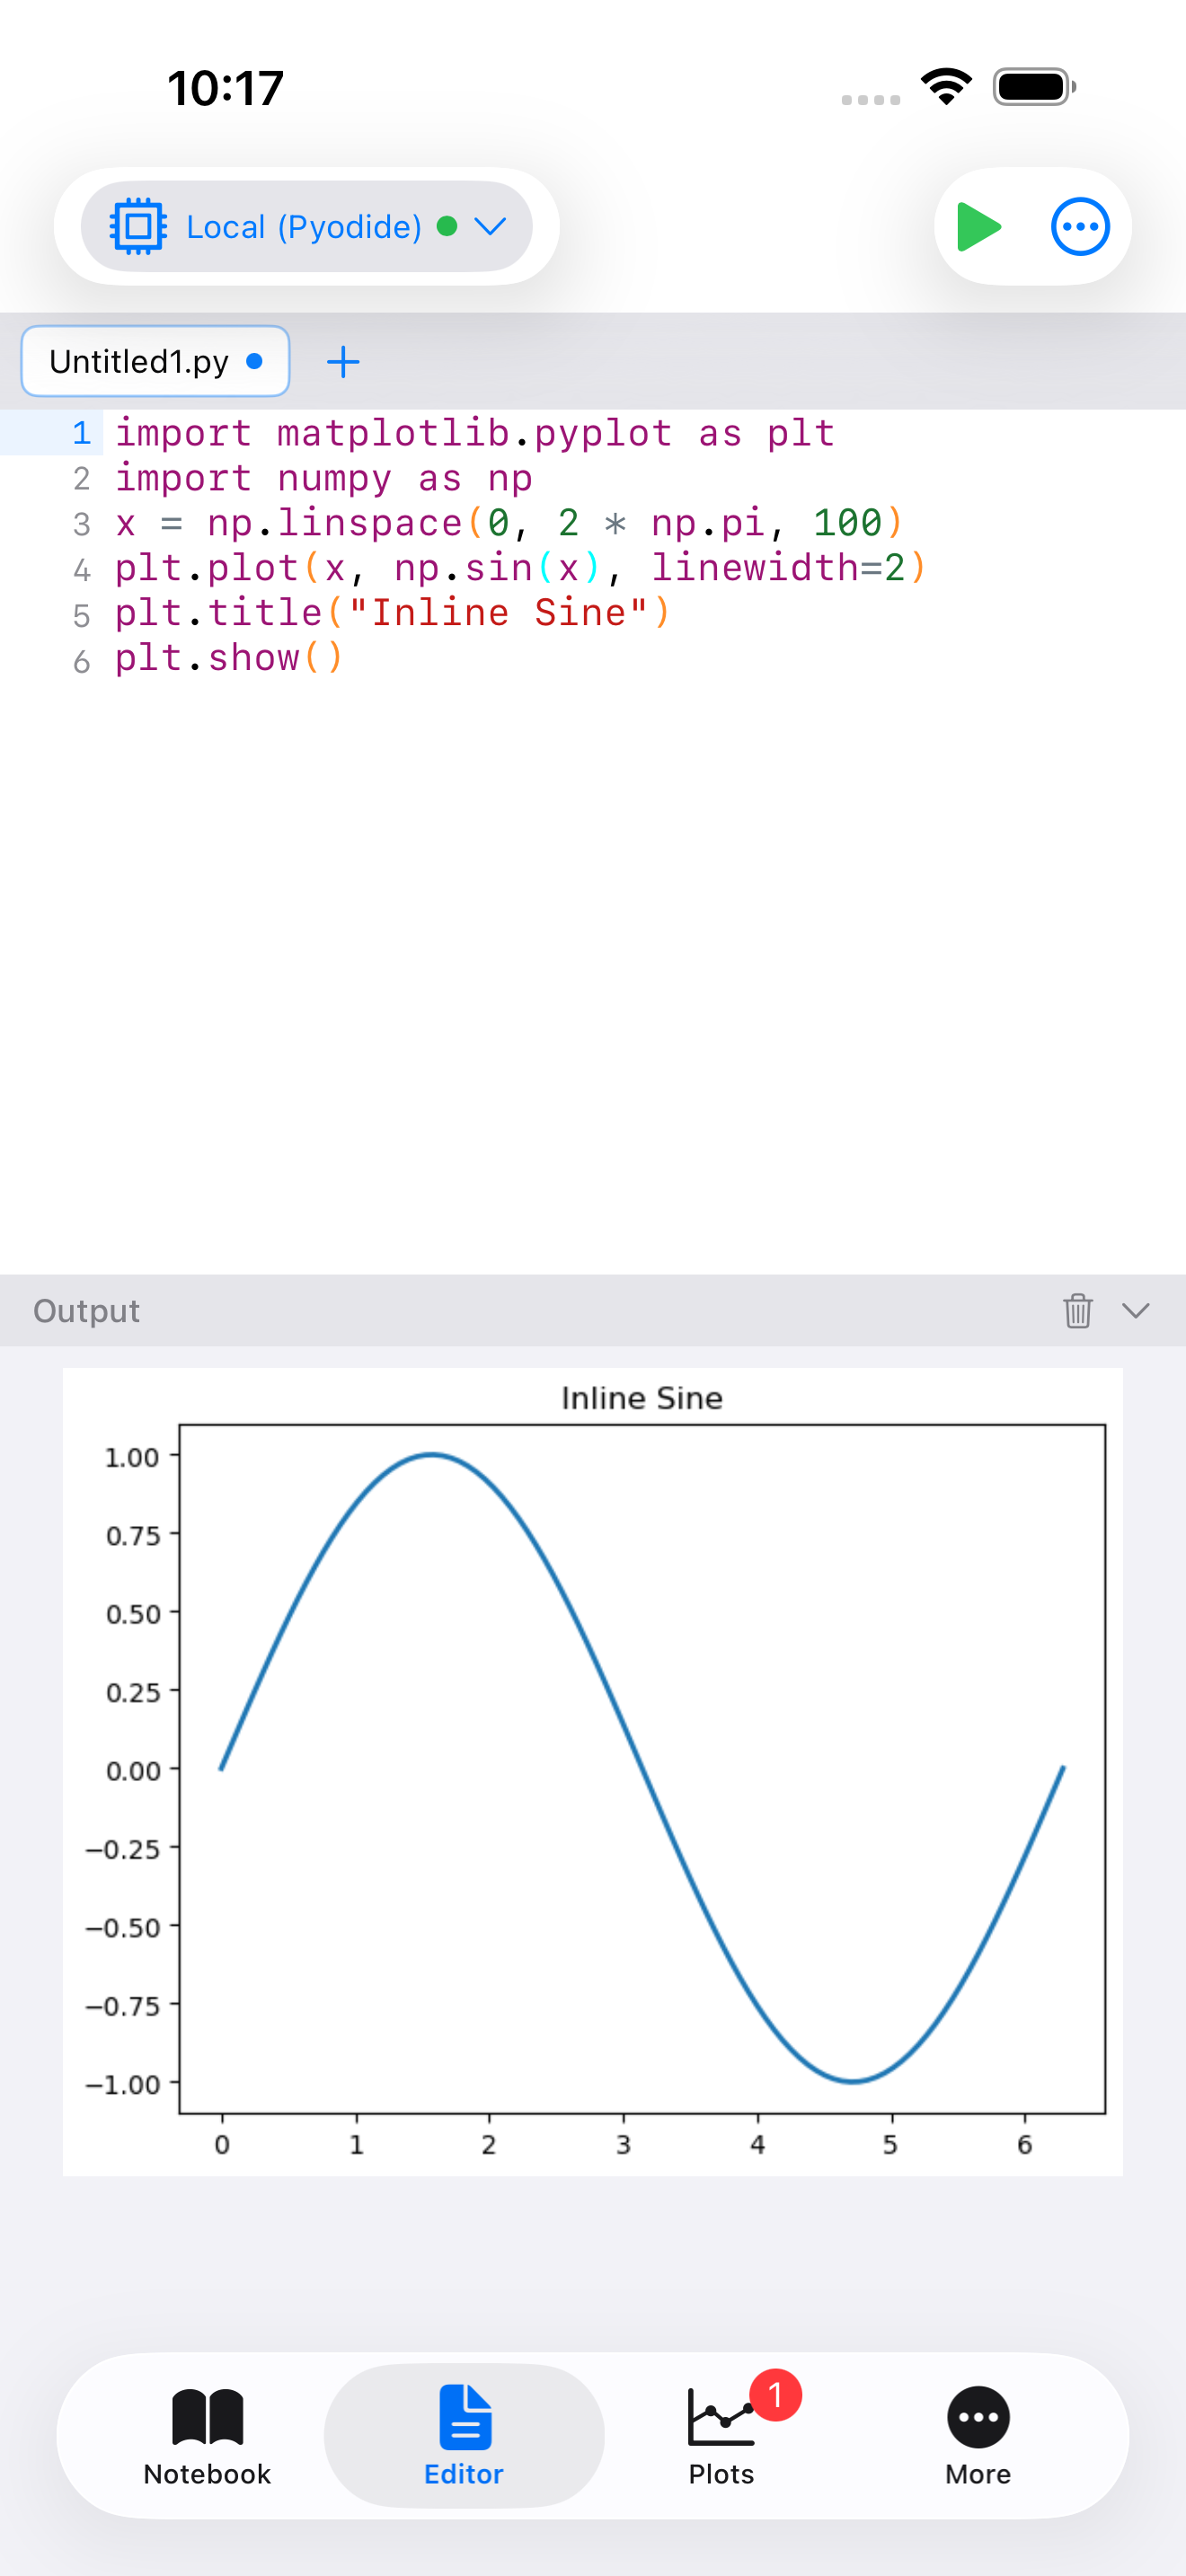
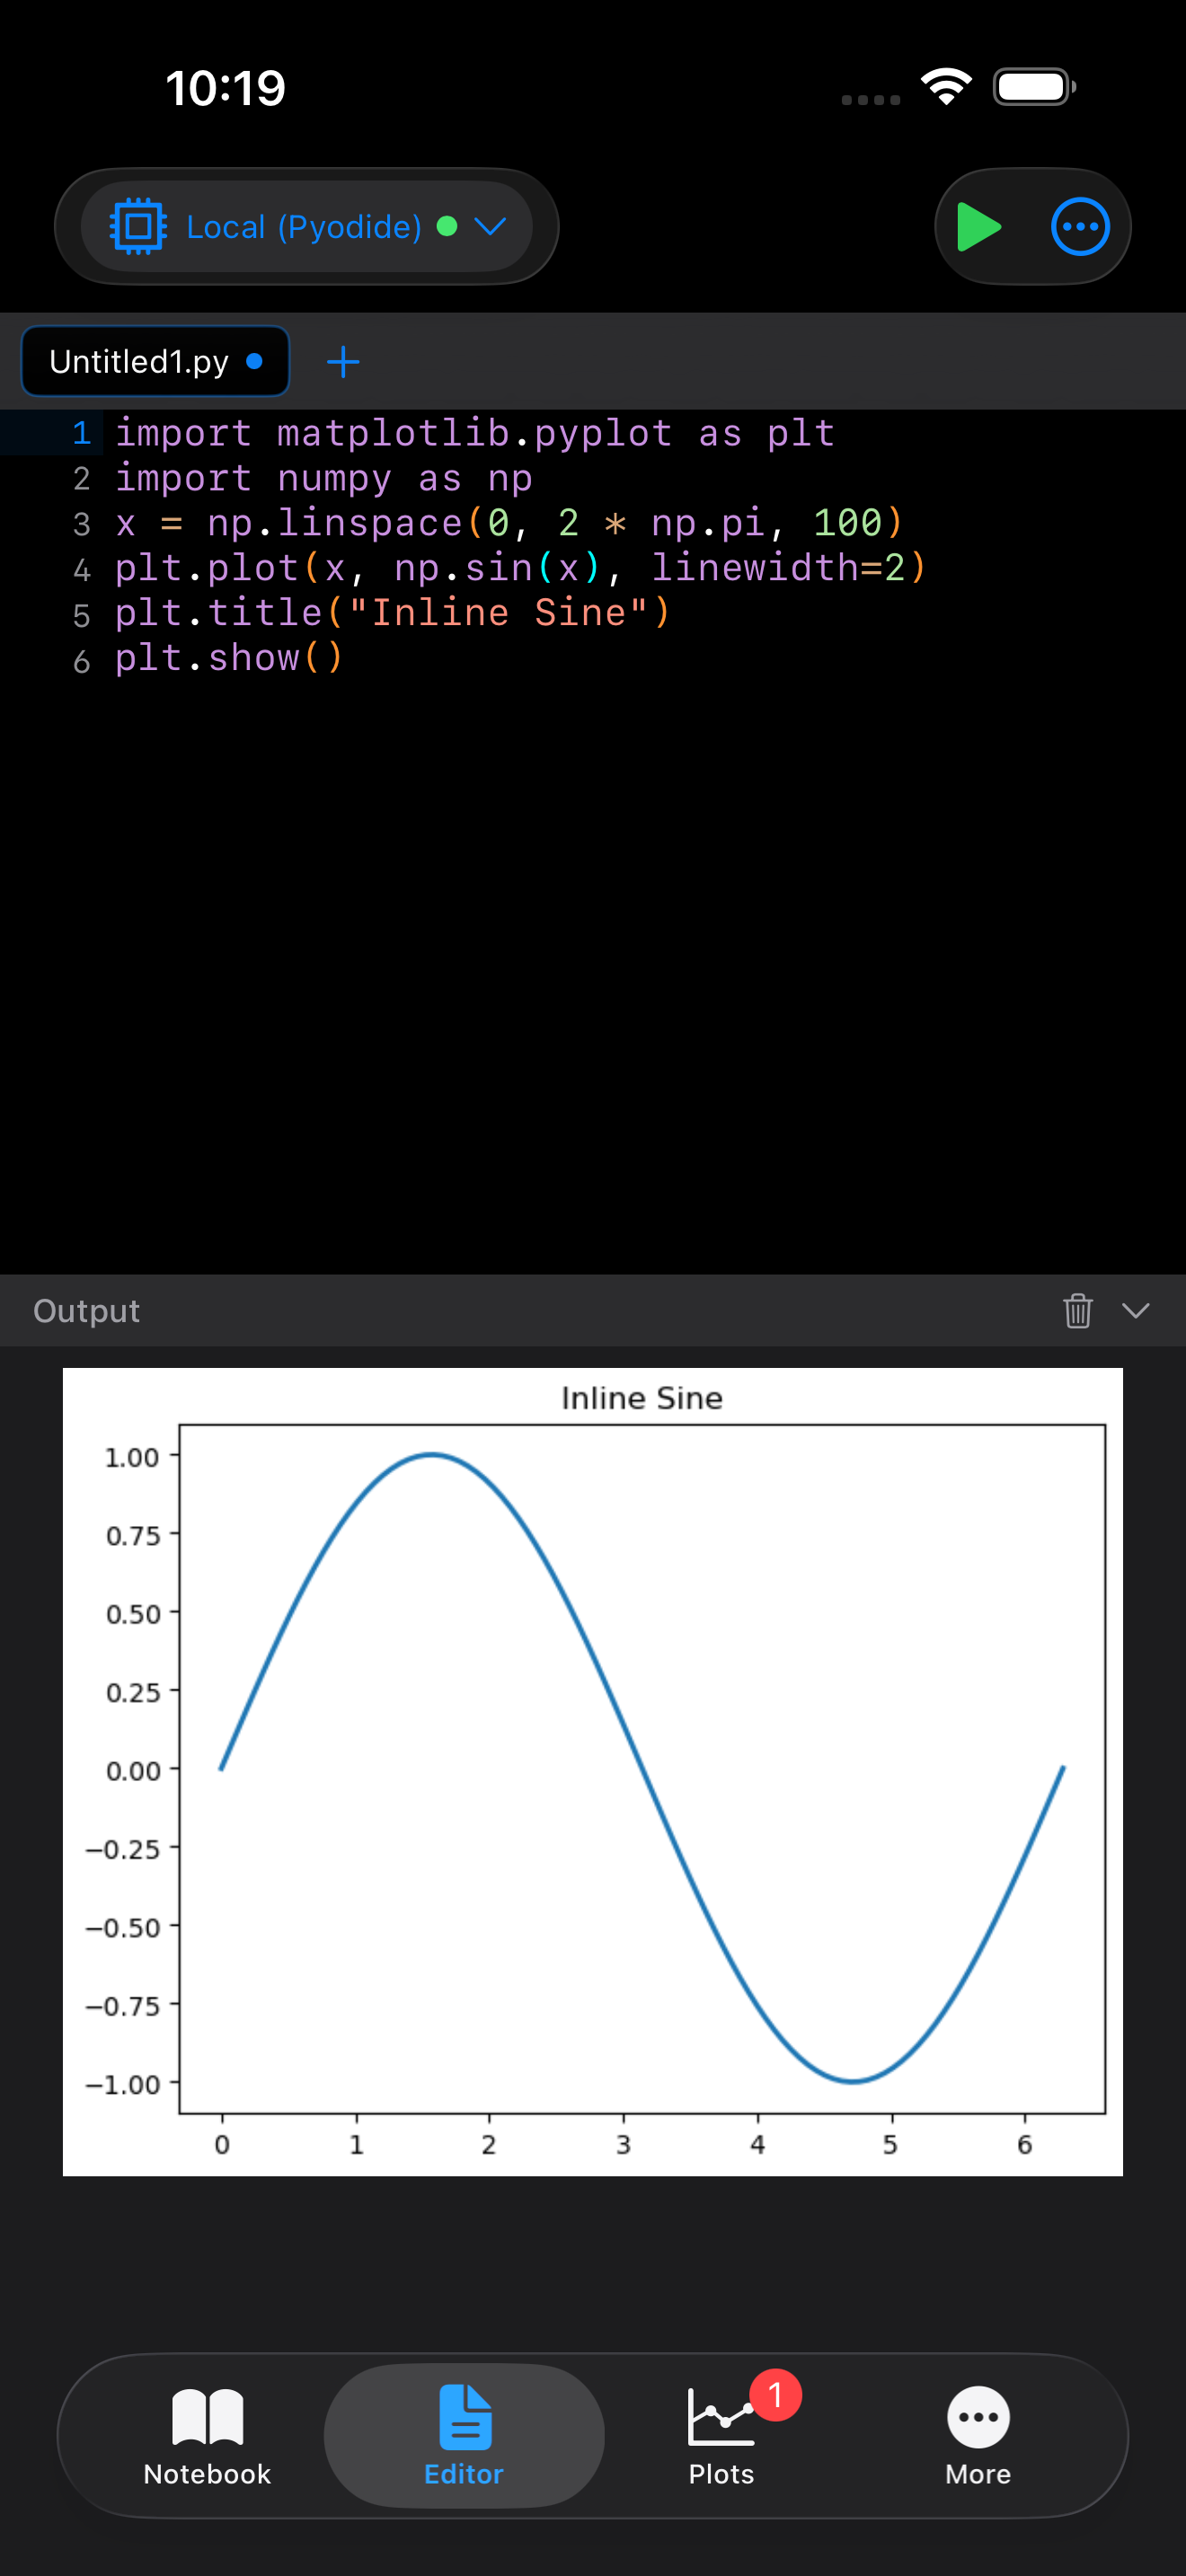
Inline Plot Output in the Editor and Console
When your code runs from the Editor or the Console, matplotlib figures and other rich outputs (Plotly, SVG, HTML) appear inline next to the code that produced them, so you don’t have to flip over to the Plots tab to check what you just rendered. The plot still lands in the Plots gallery for later pinning, comparison, or export, but the immediate feedback lives right where you’re working.
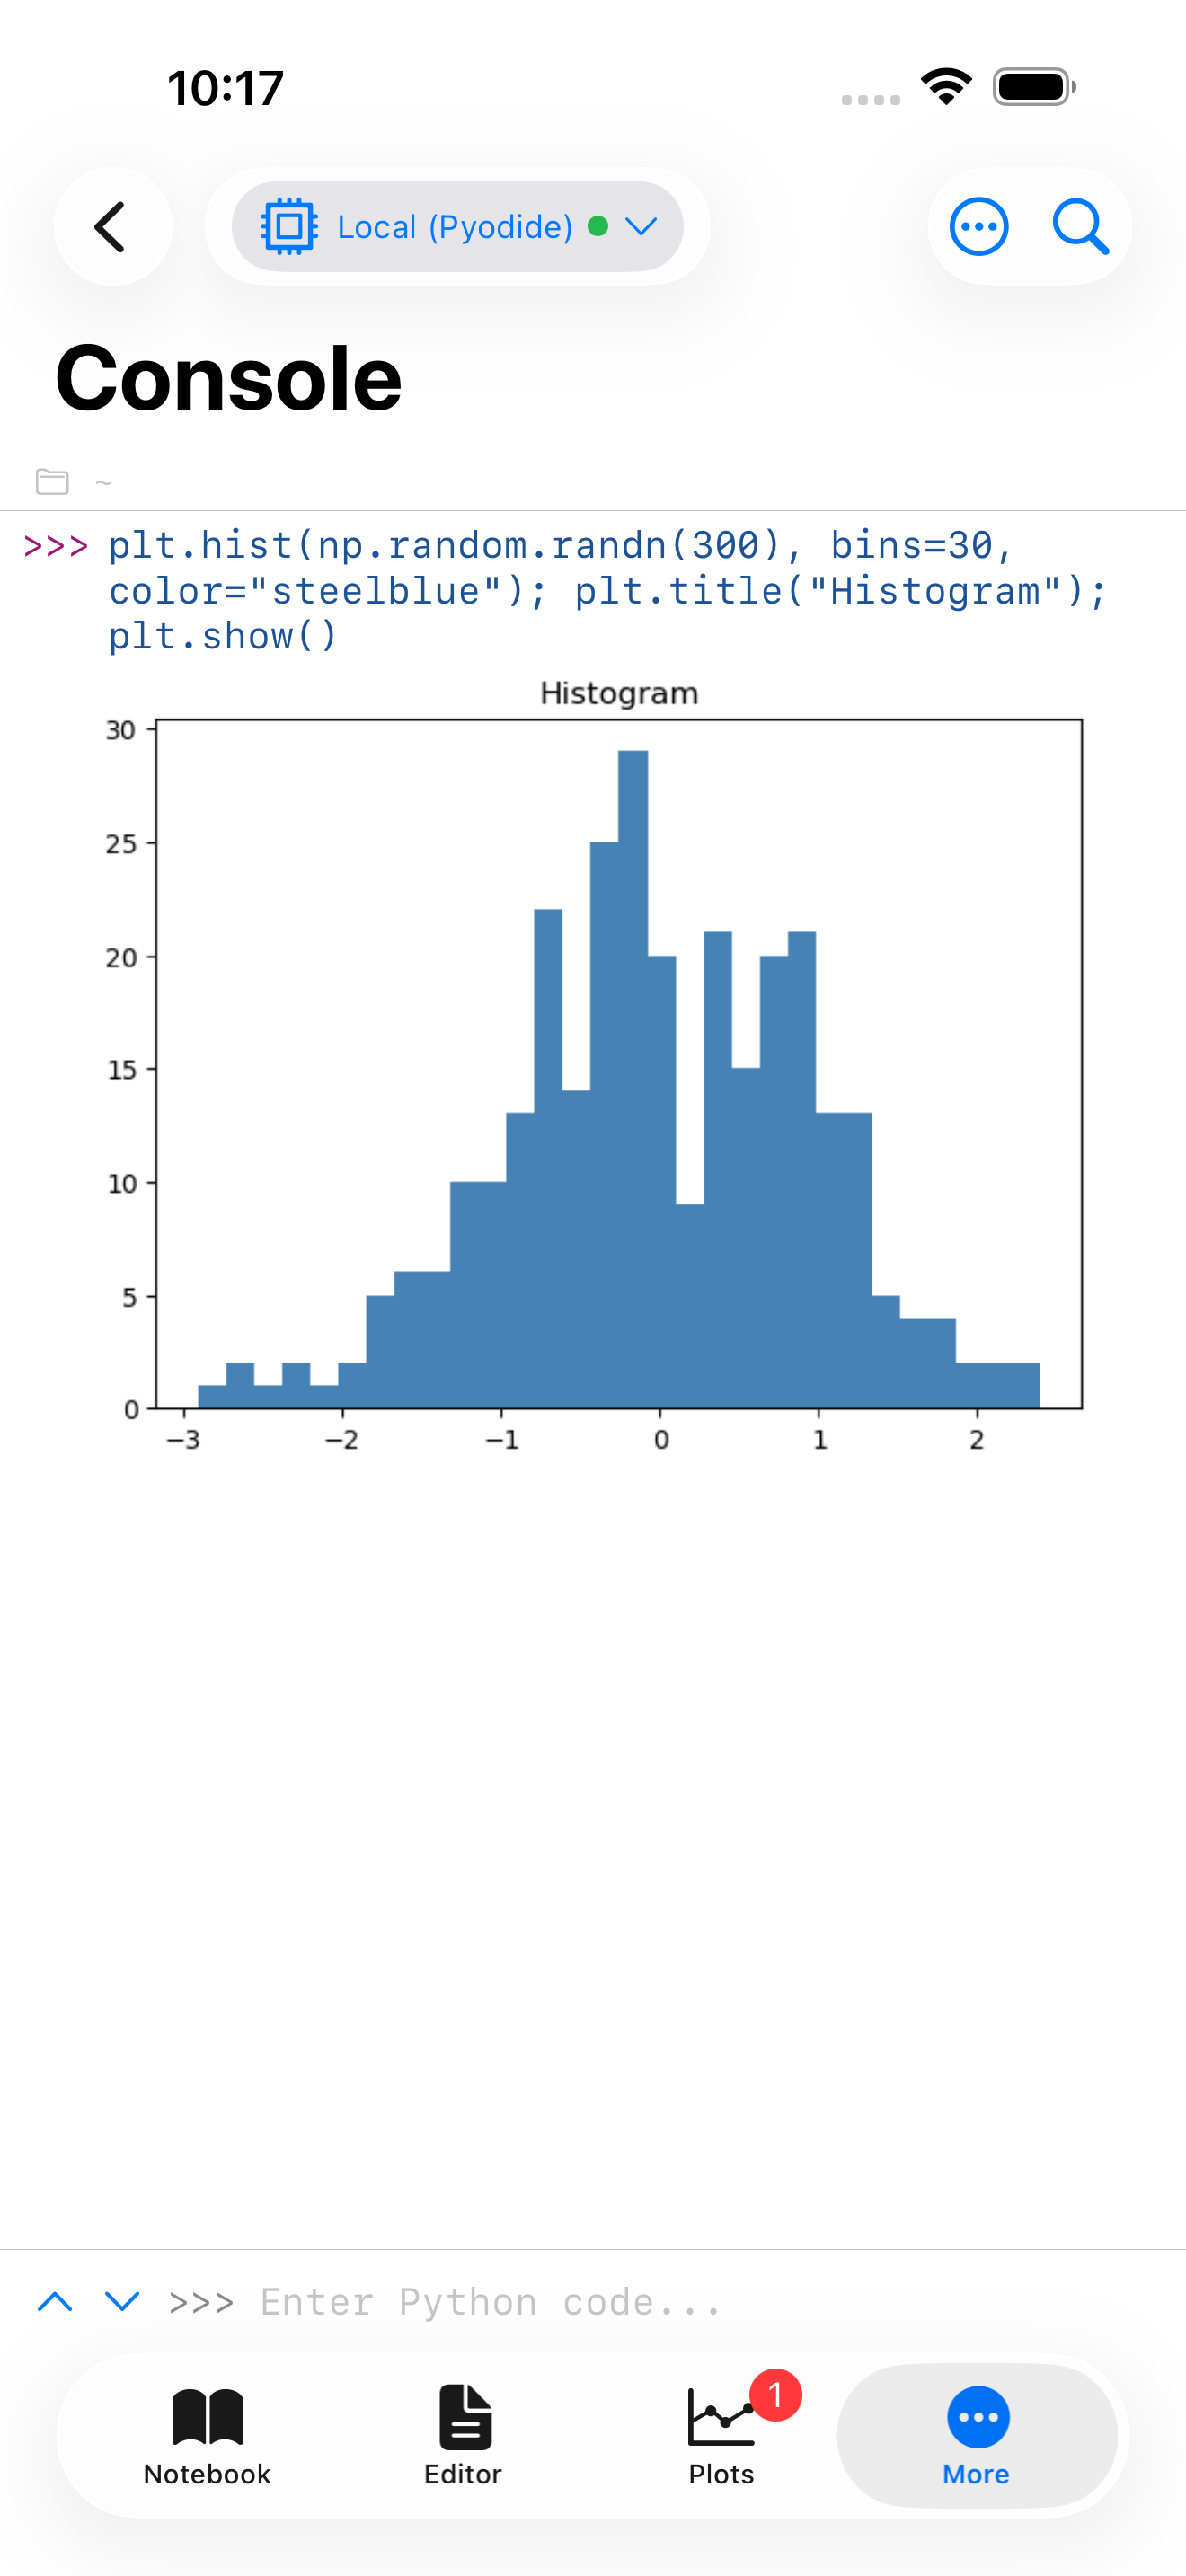
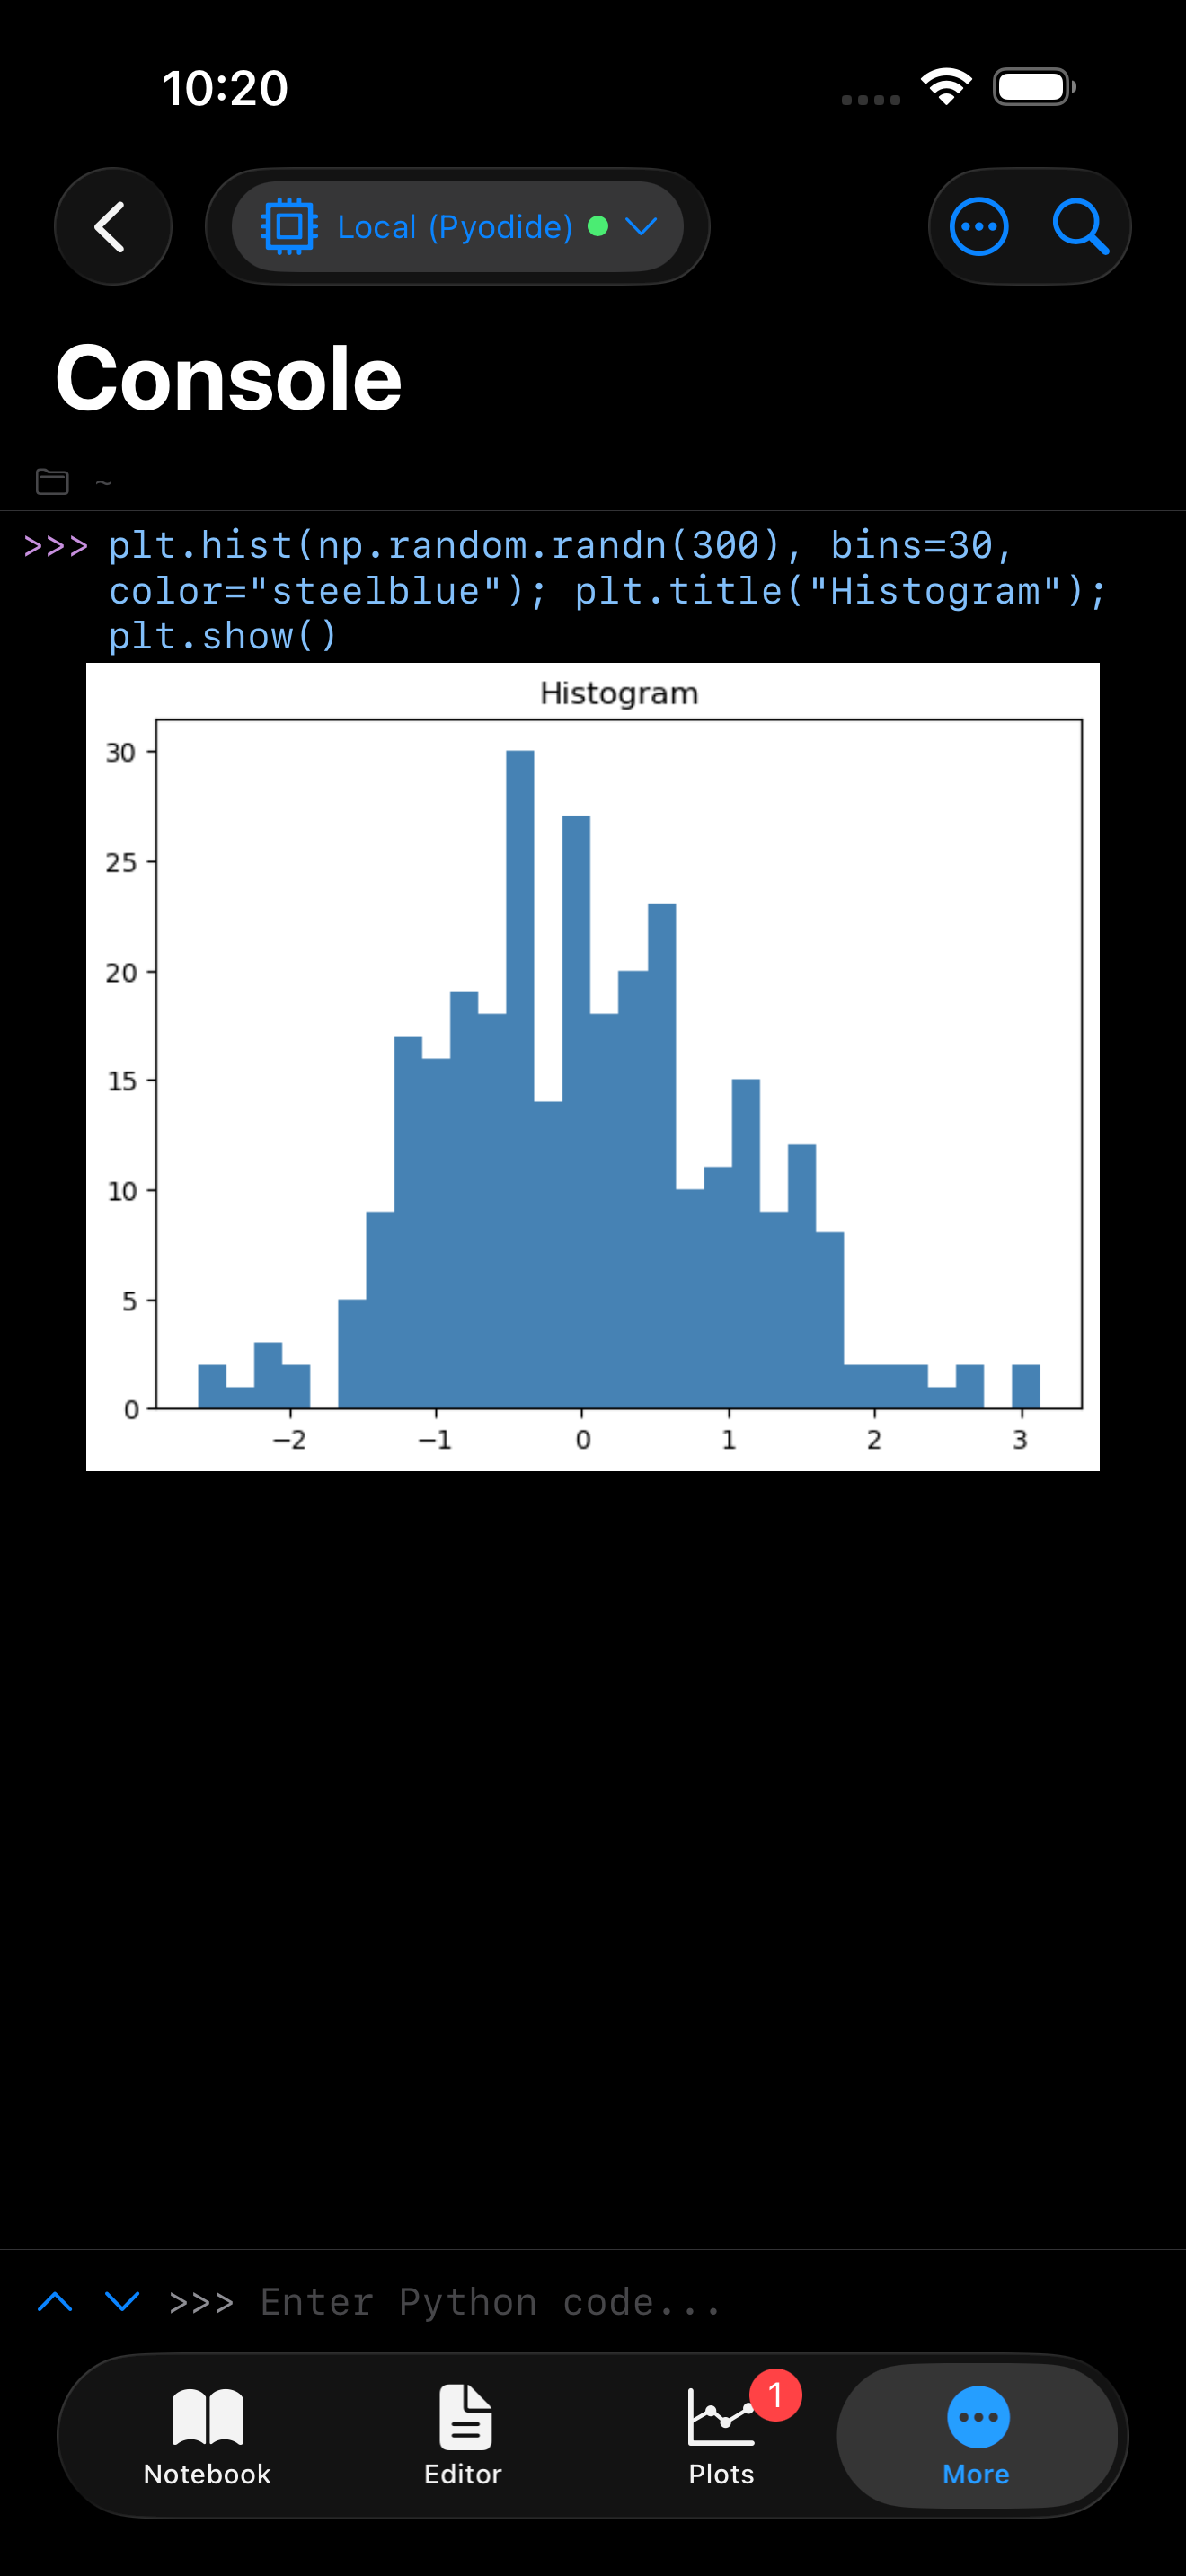
Inline plots in the Console can be disabled via Settings > Console > Inline plots if you prefer a strictly text-only console. The figures still appear in the Plots gallery either way.
Sharing and Exporting
There are two ways to get plots out of the app:
Quick share. From the detail view, tap the share button to use the standard iOS share sheet. This lets you save to Photos, copy to the clipboard, AirDrop to a Mac, or send through any app.
File export with format options. From the detail view, tap the export button (the download icon) to open the Export page. Here you can:
- Choose a filename
- Pick a format: PNG (lossless, supports transparency), JPEG (smaller files), or PDF (vector container, good for printing and papers)
- Save to any location via the iOS file picker, including iCloud Drive, external drives, or other cloud storage
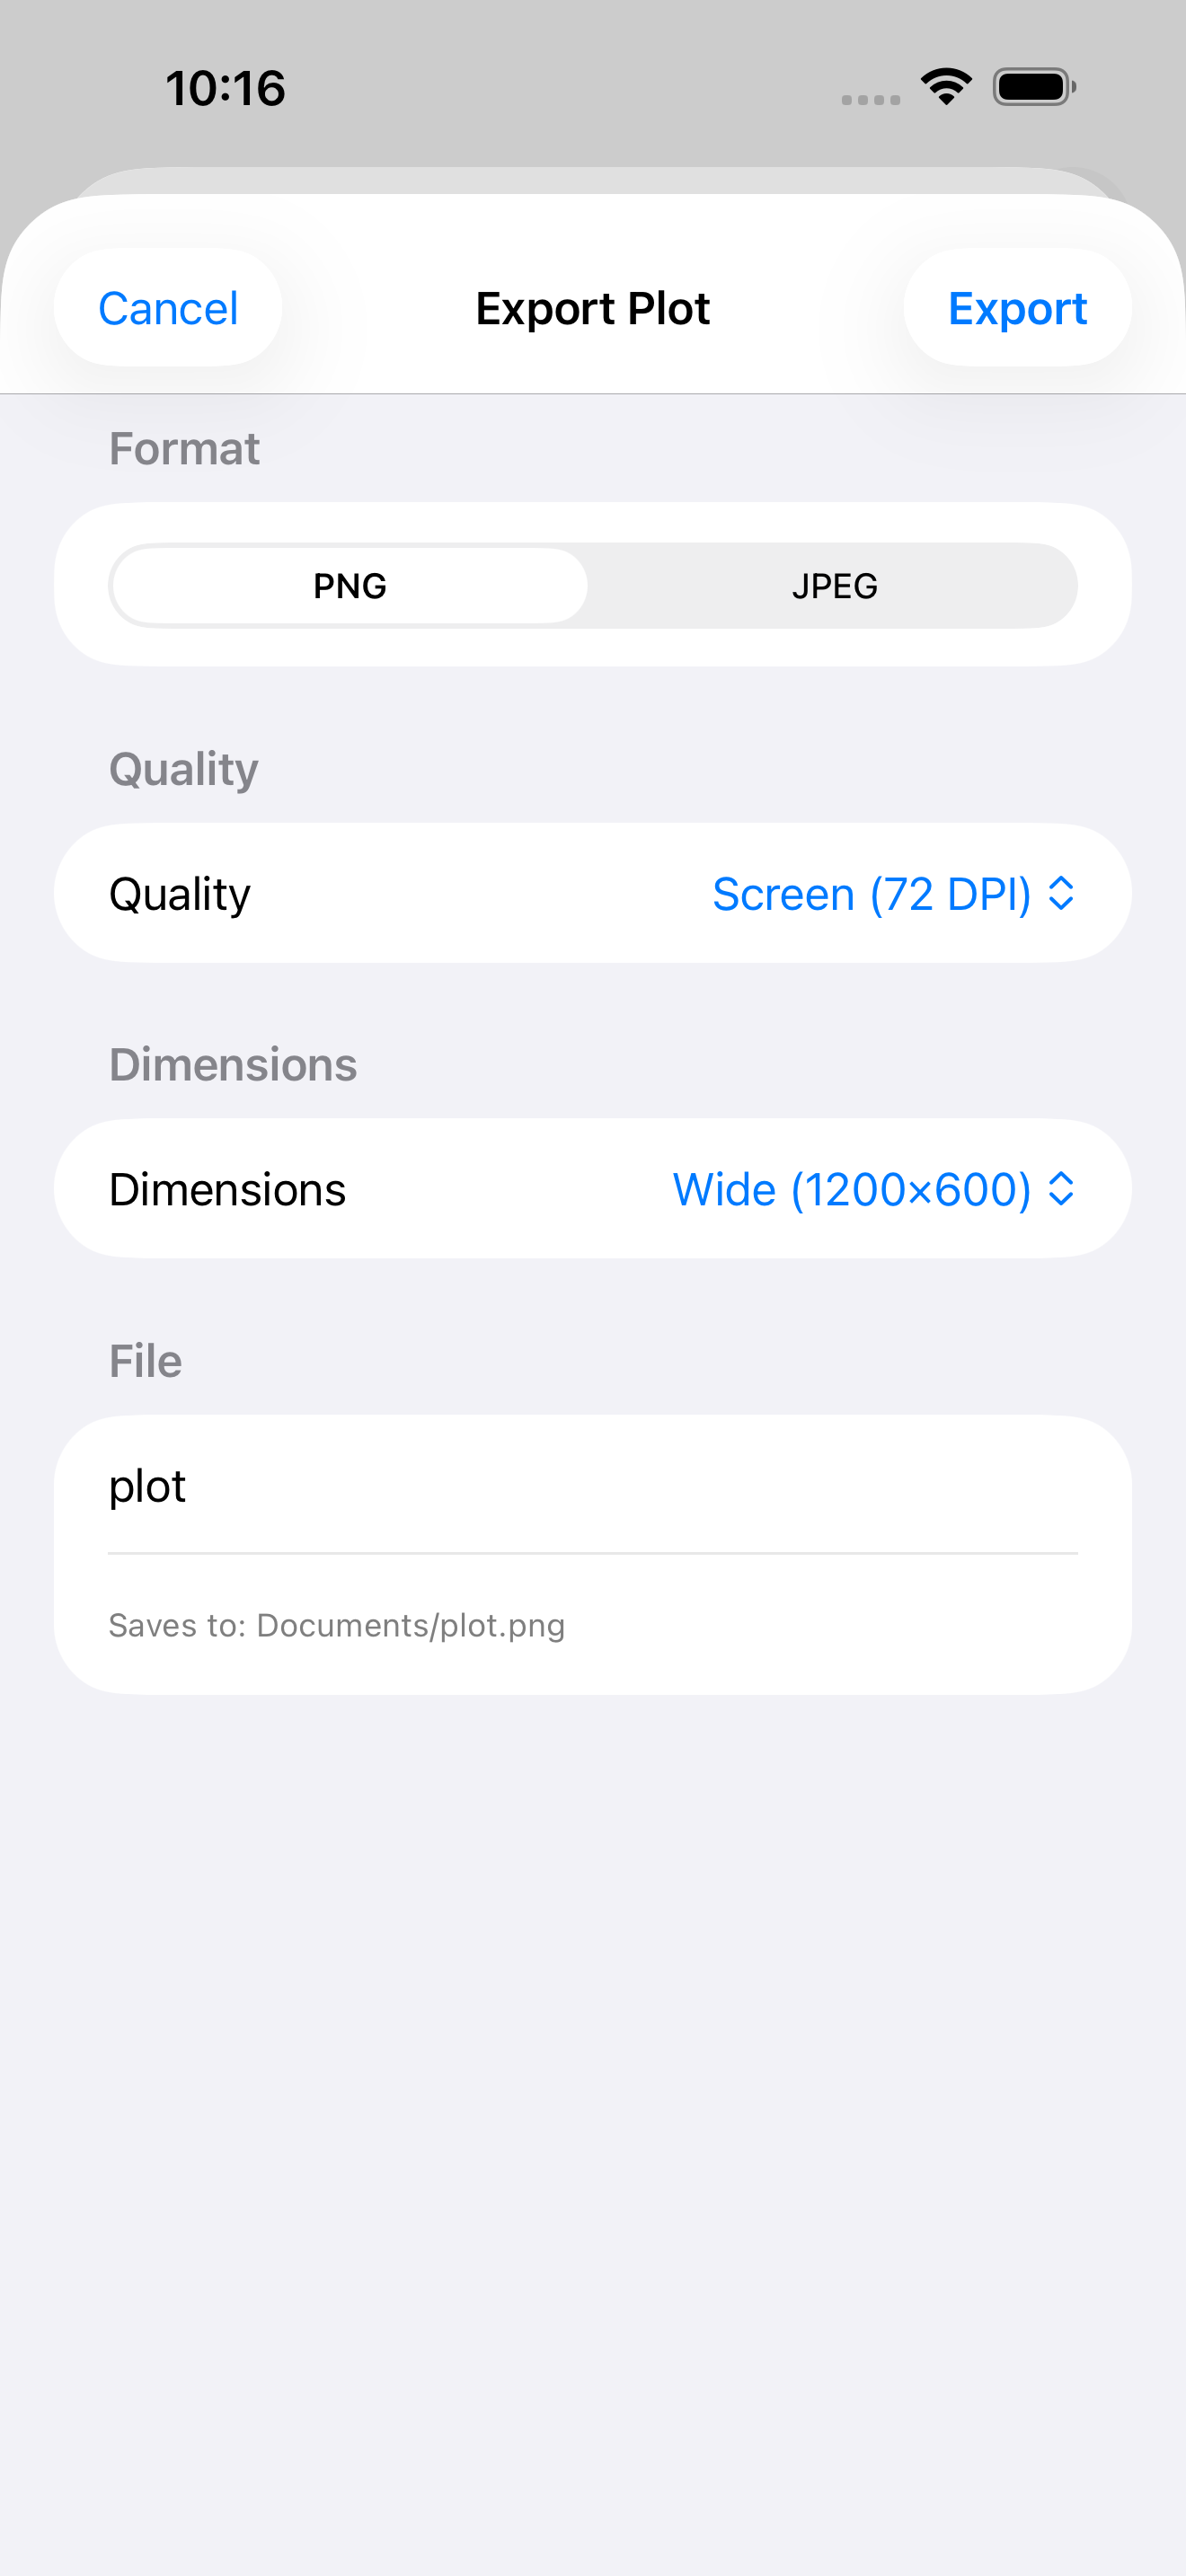
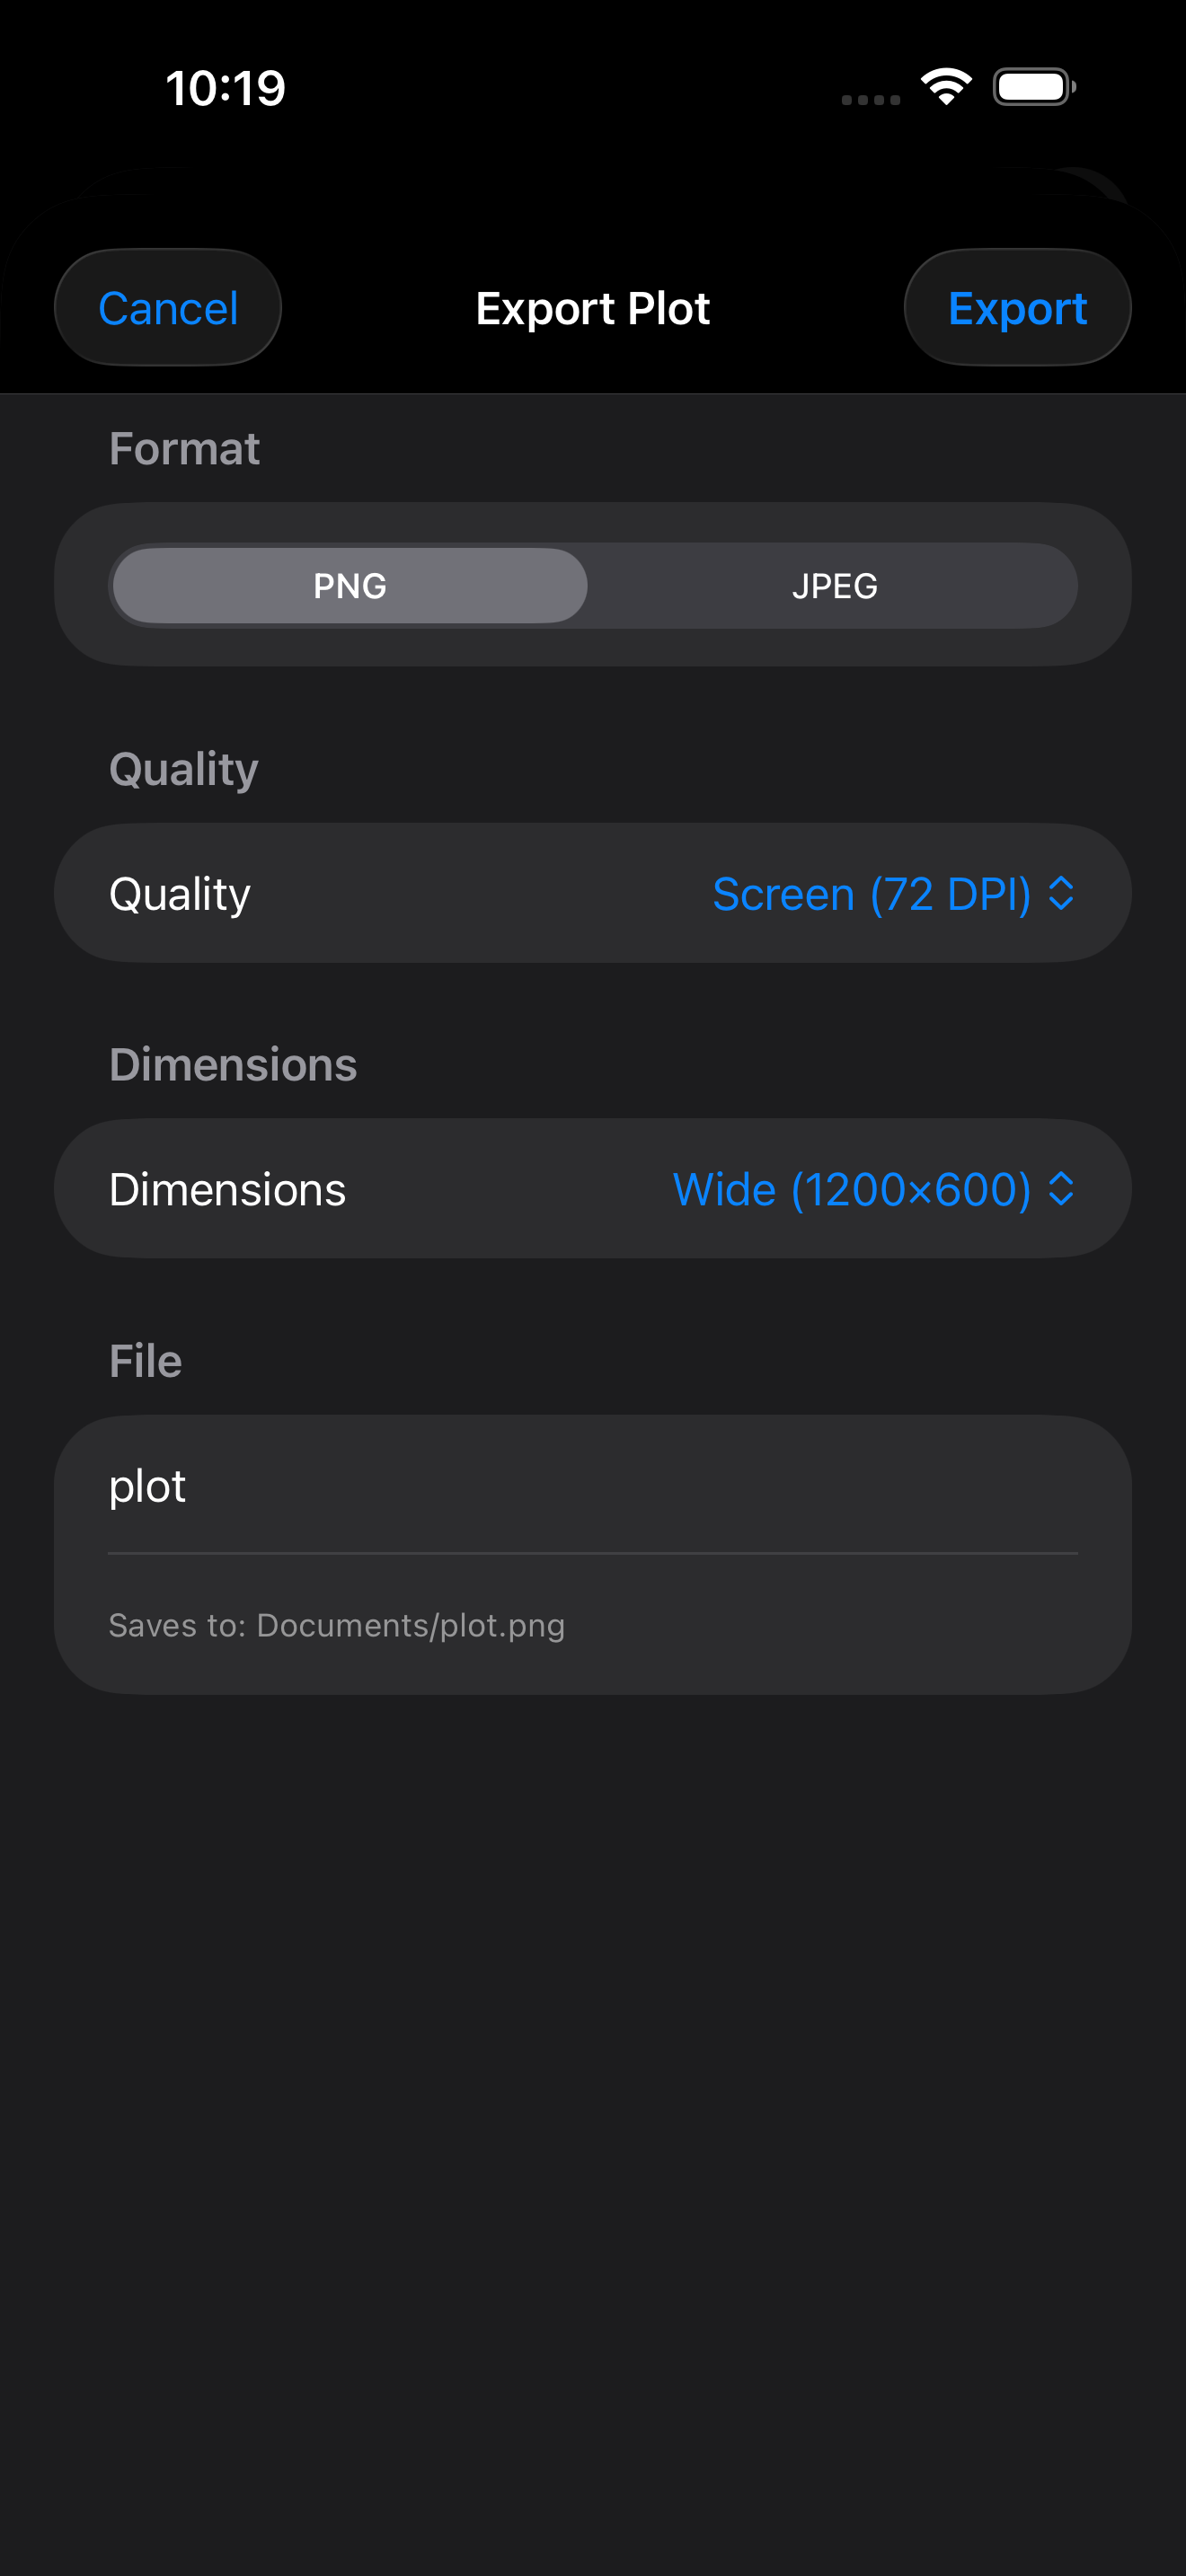
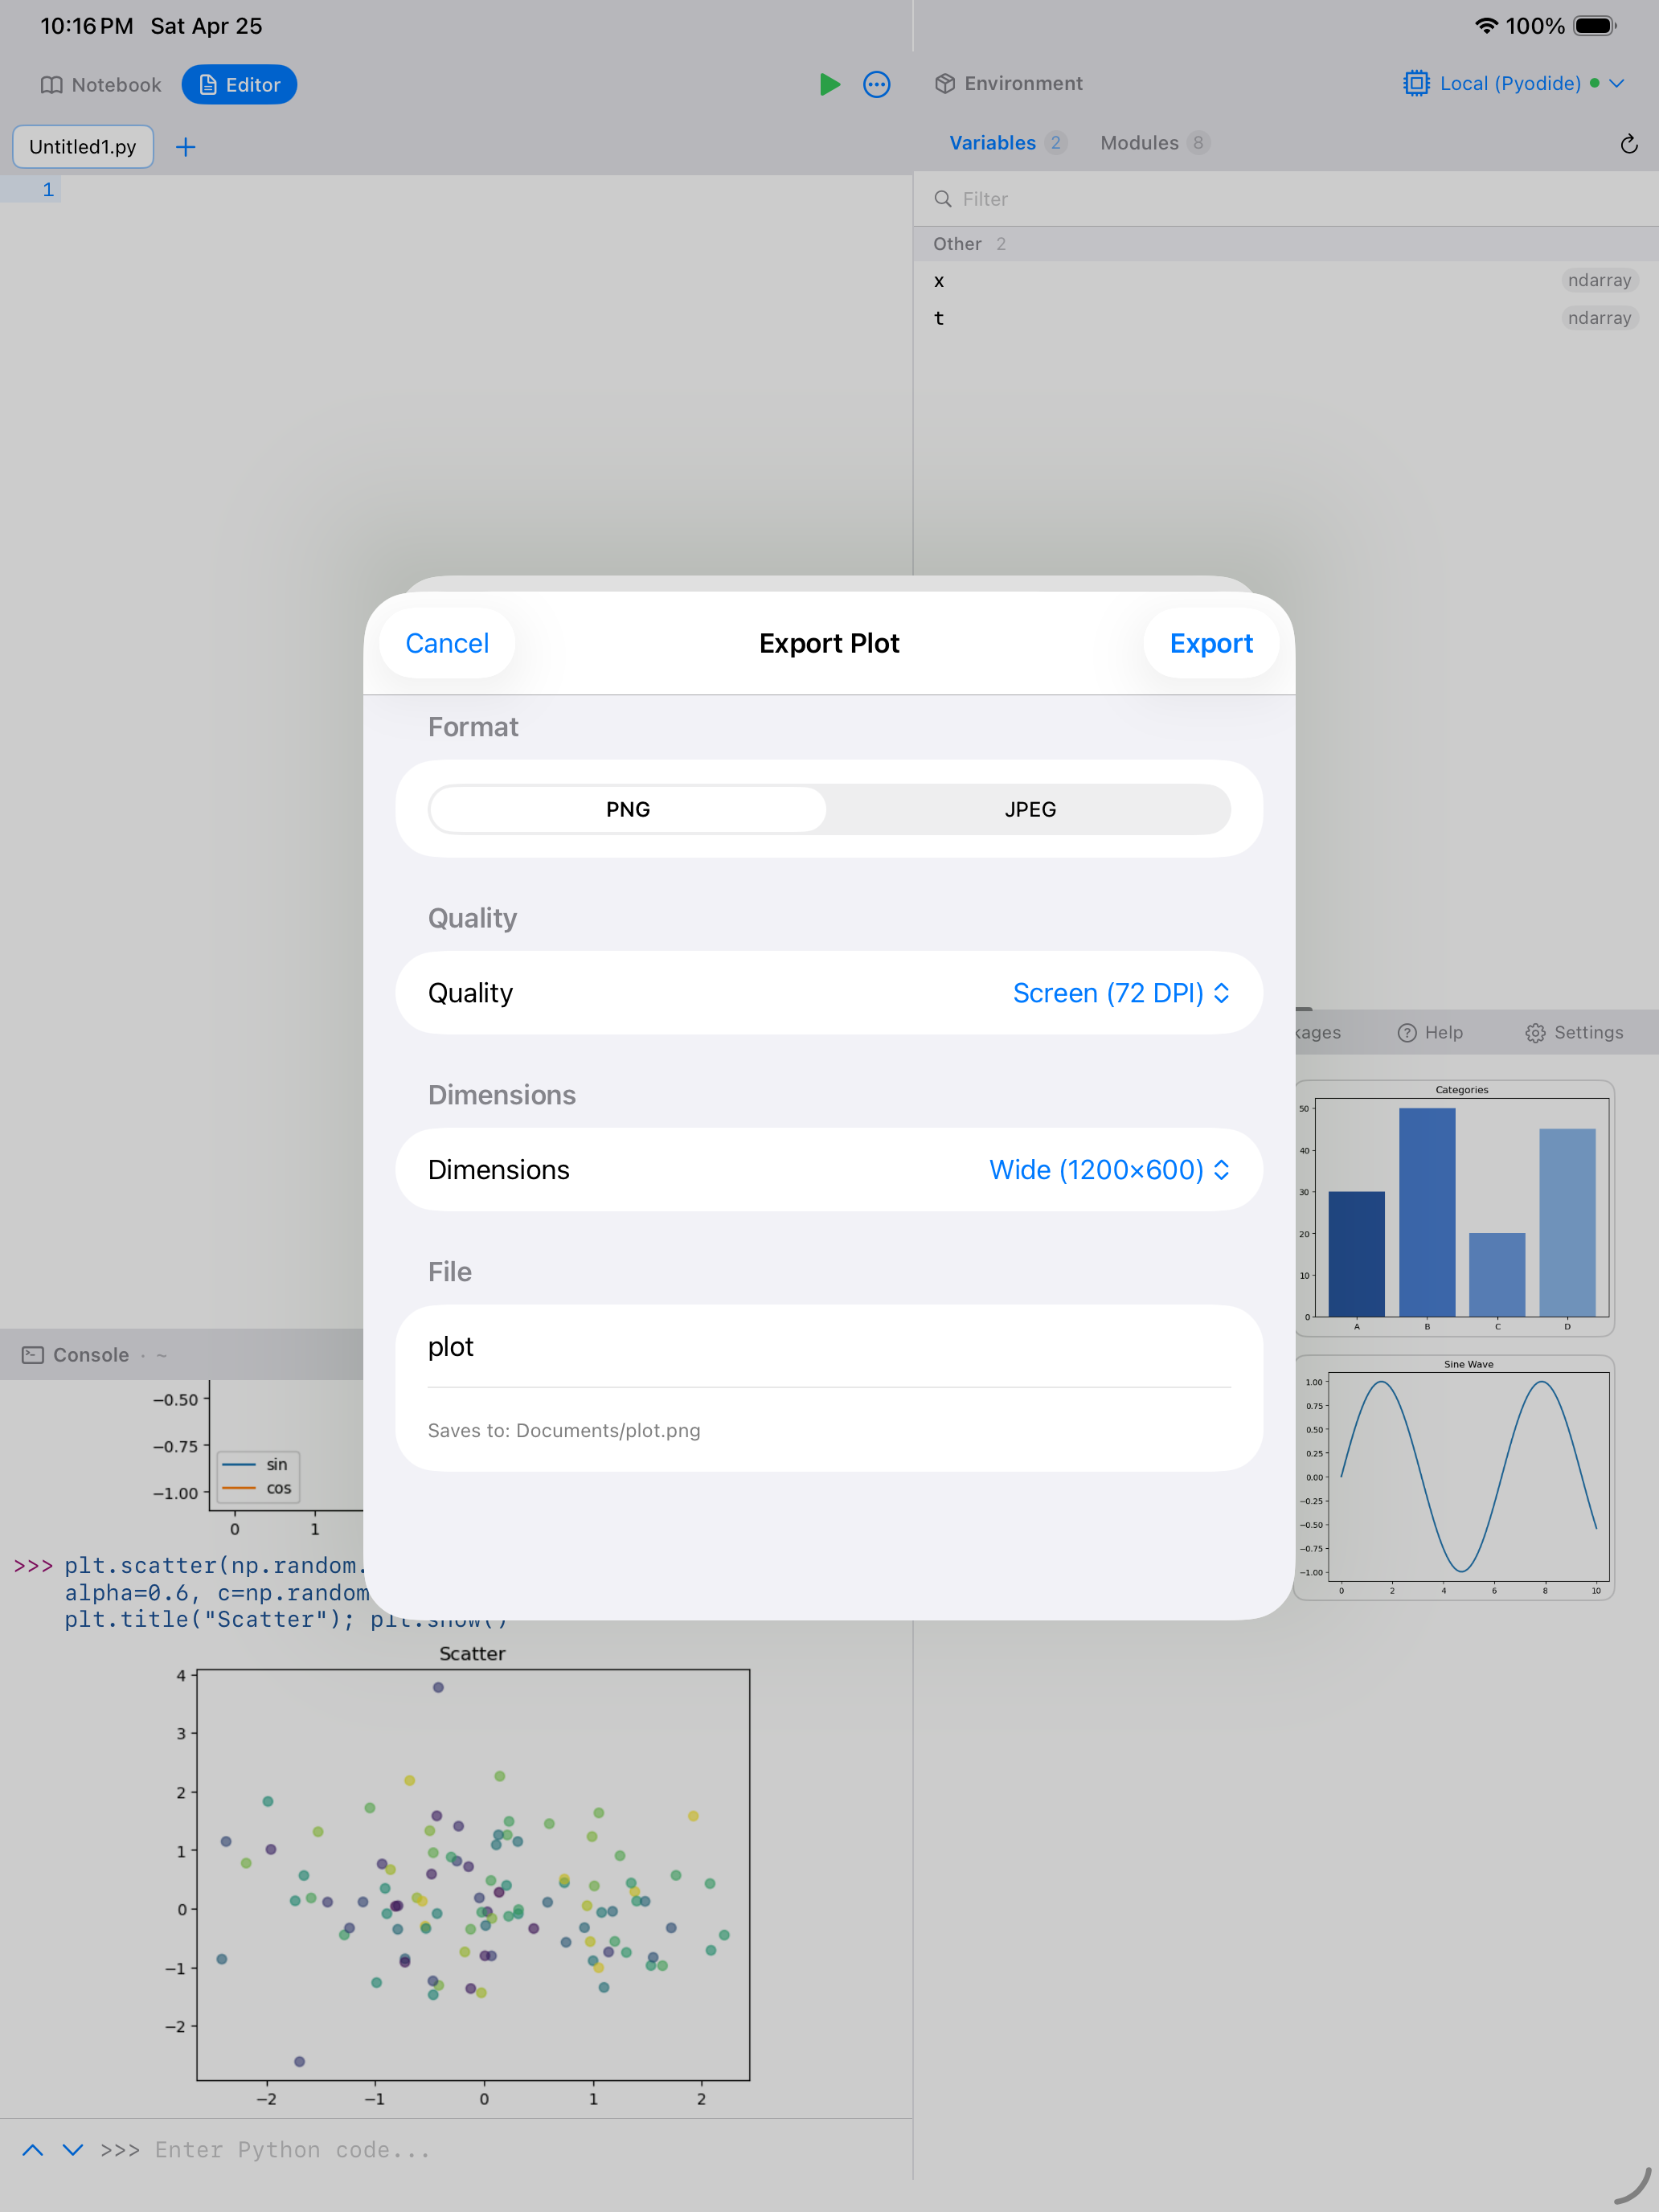
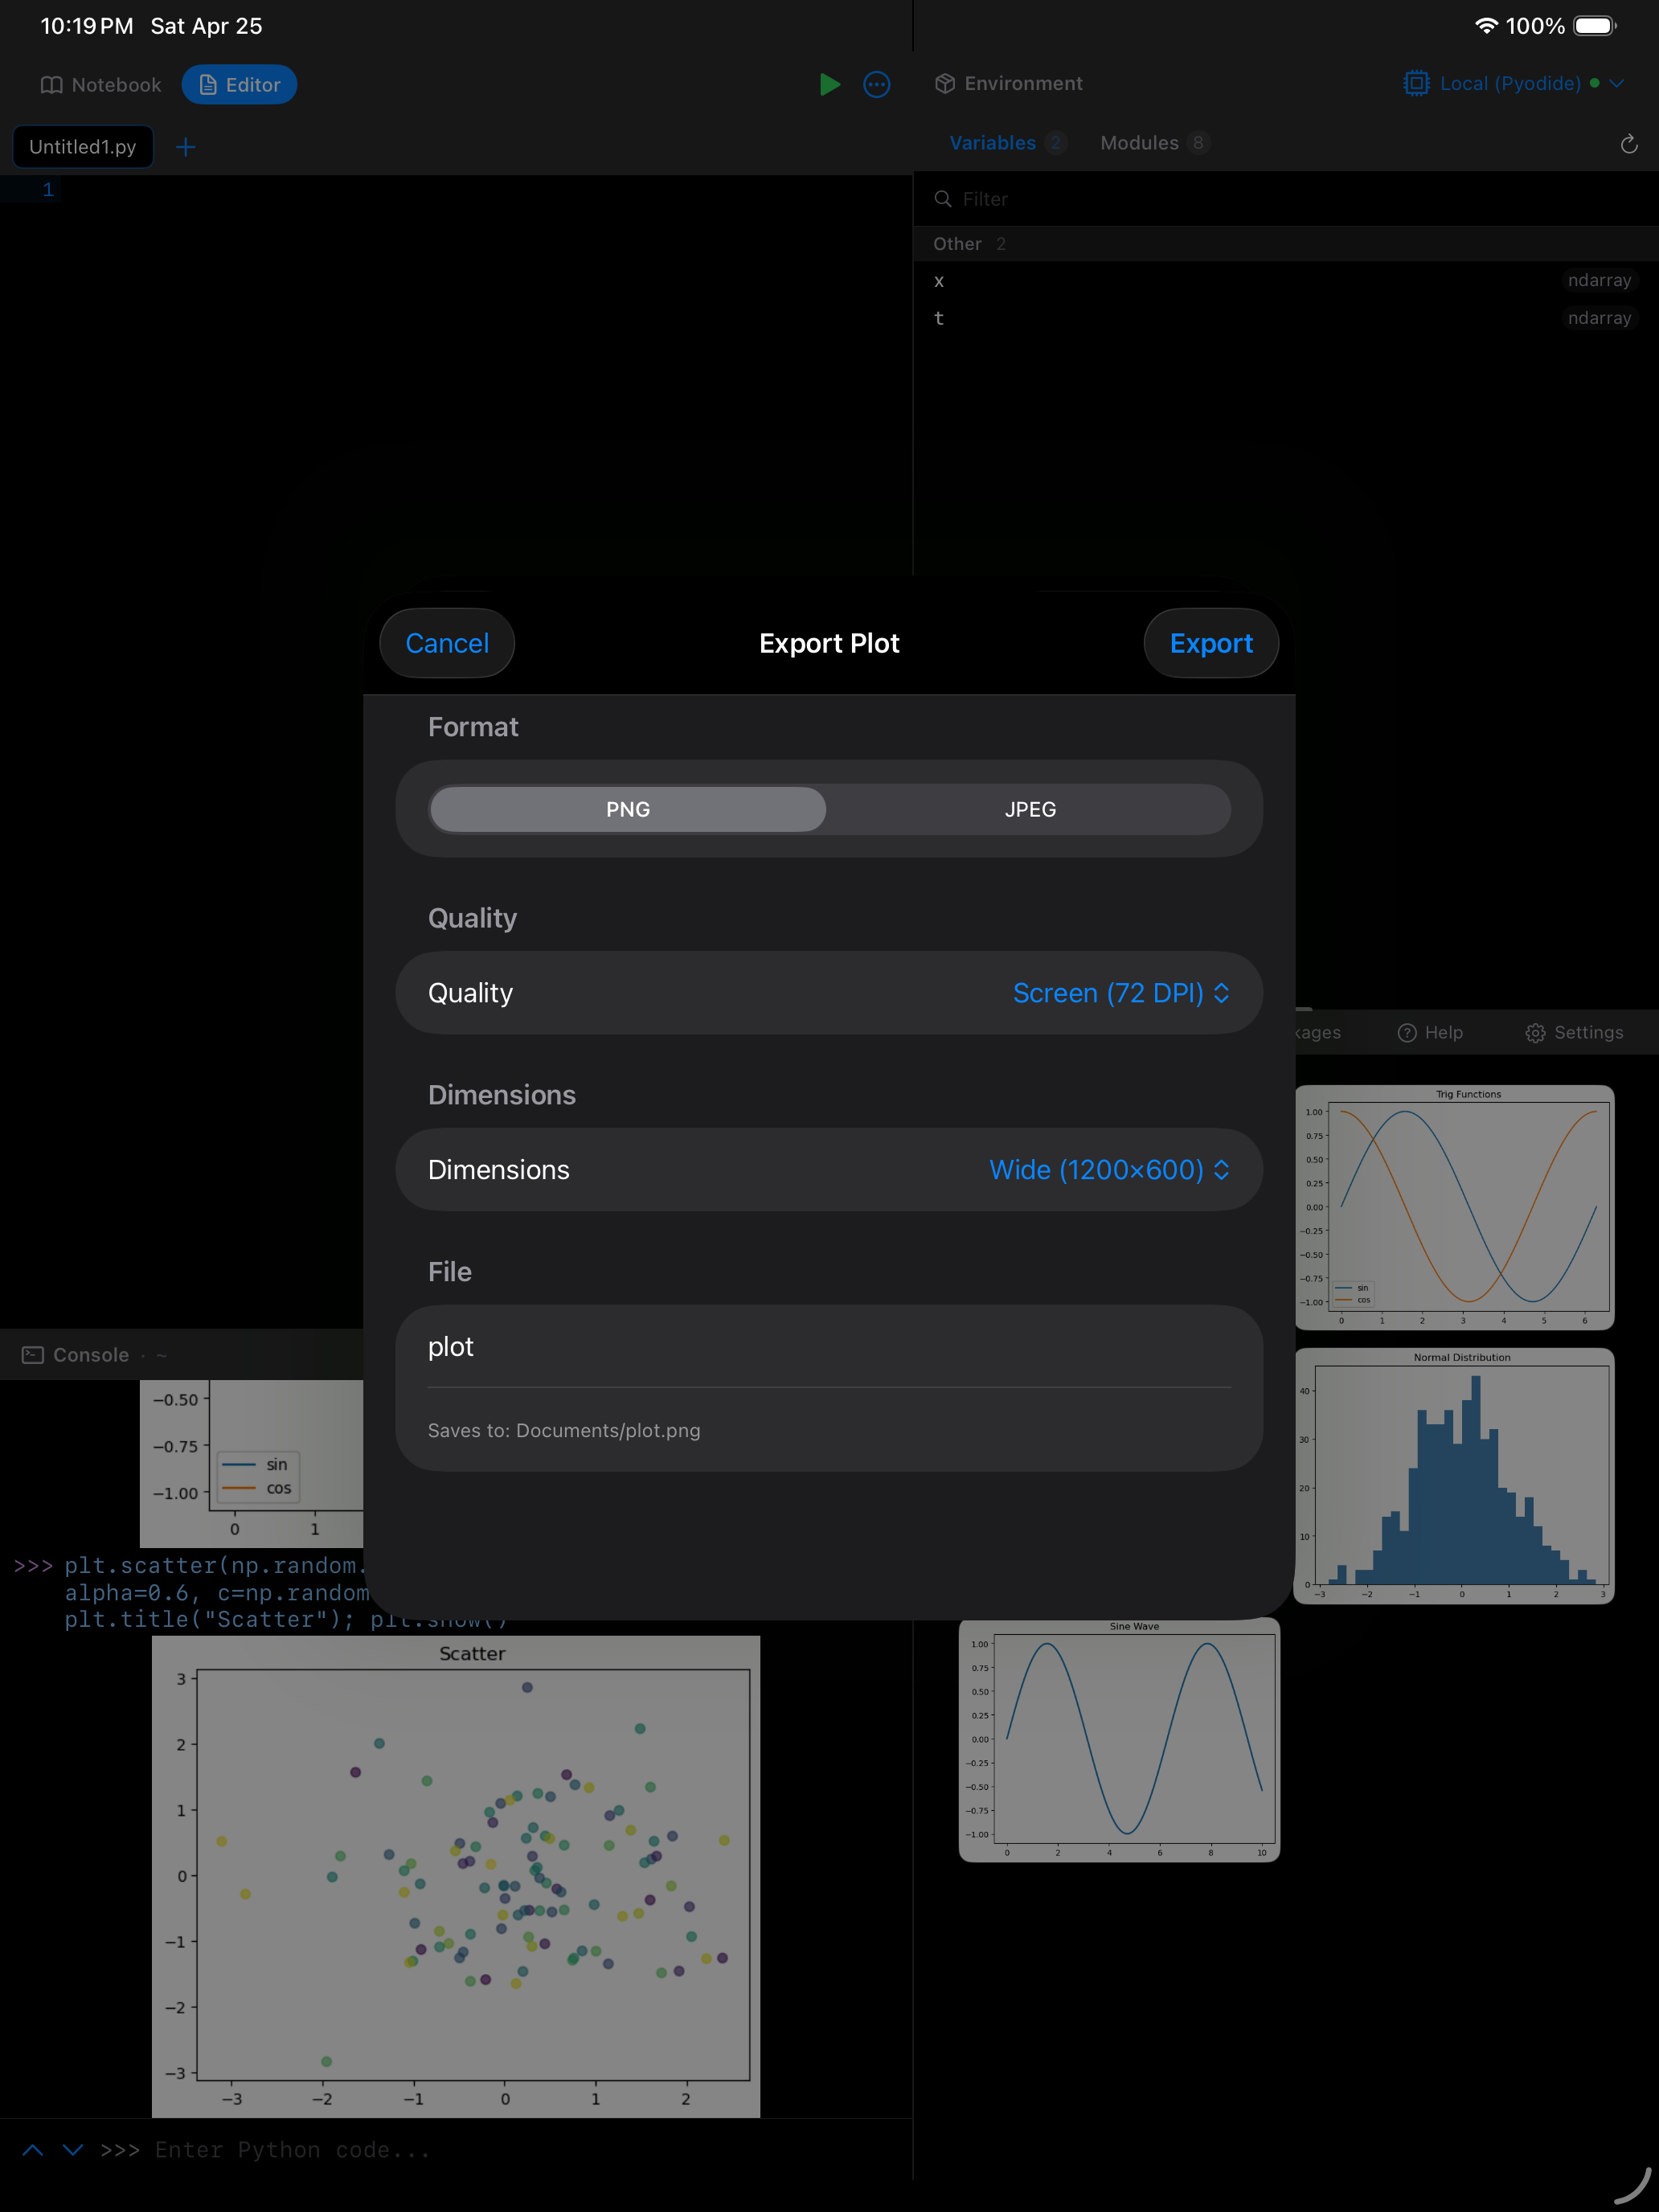
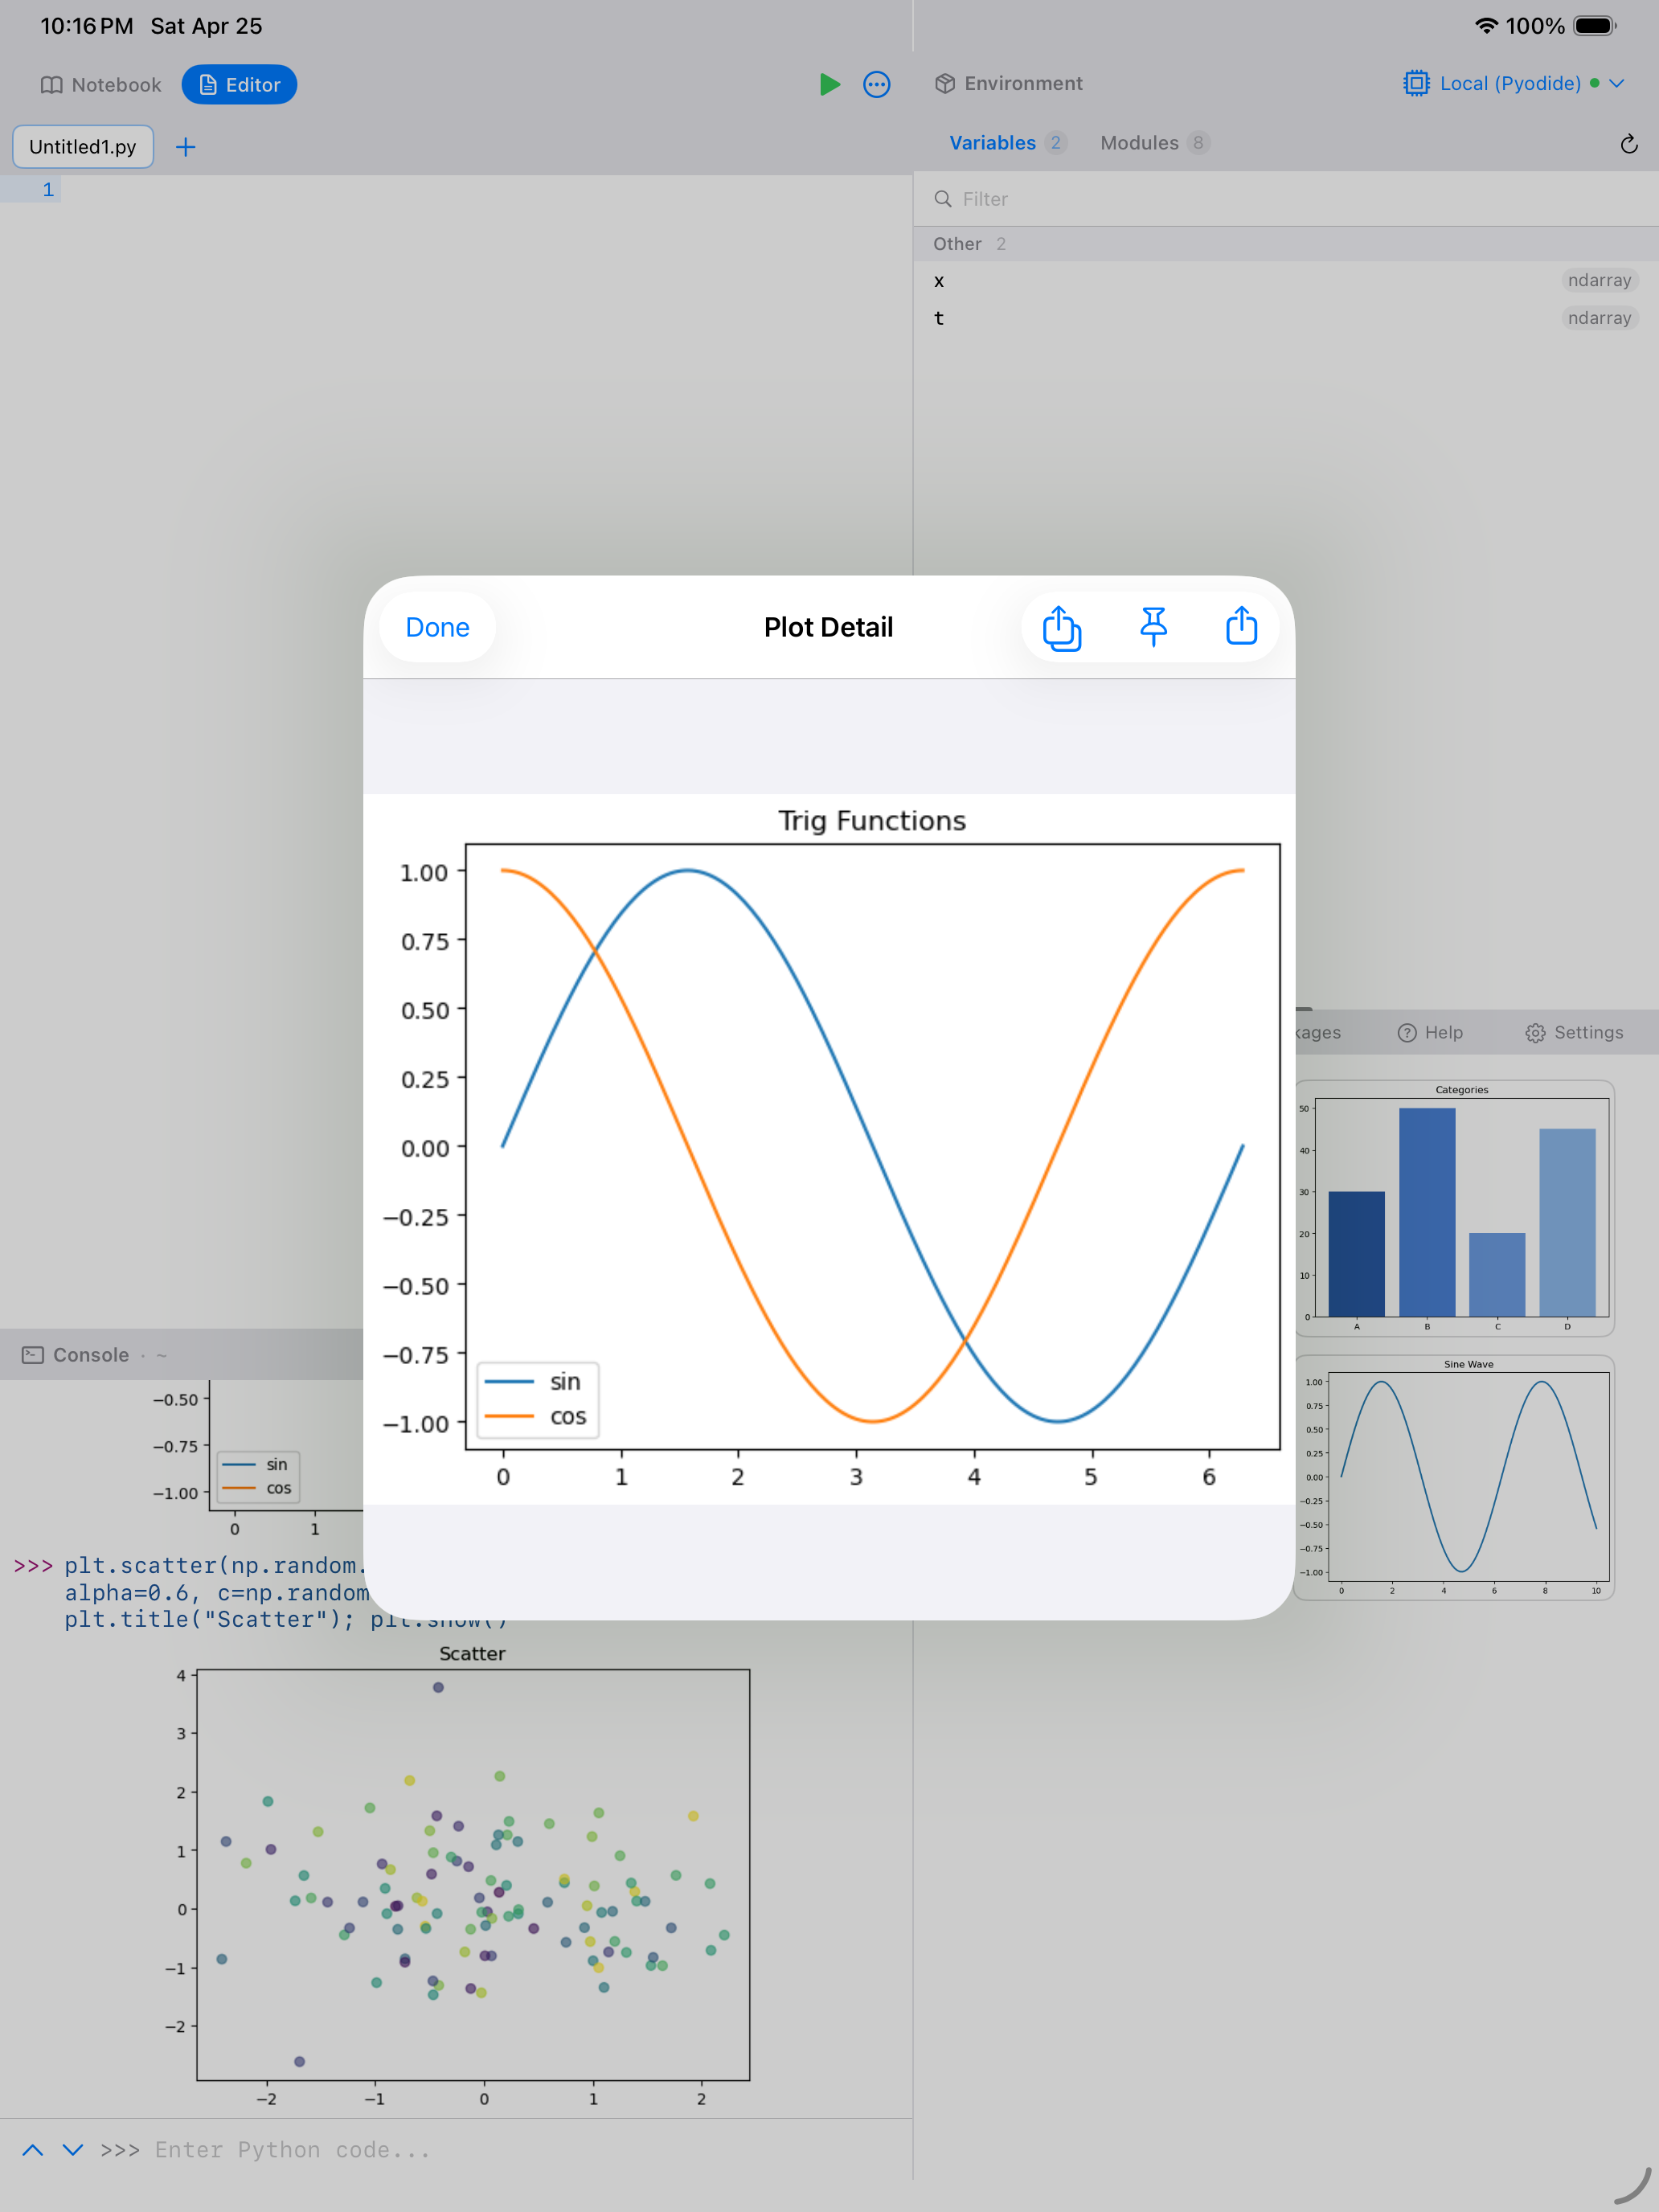
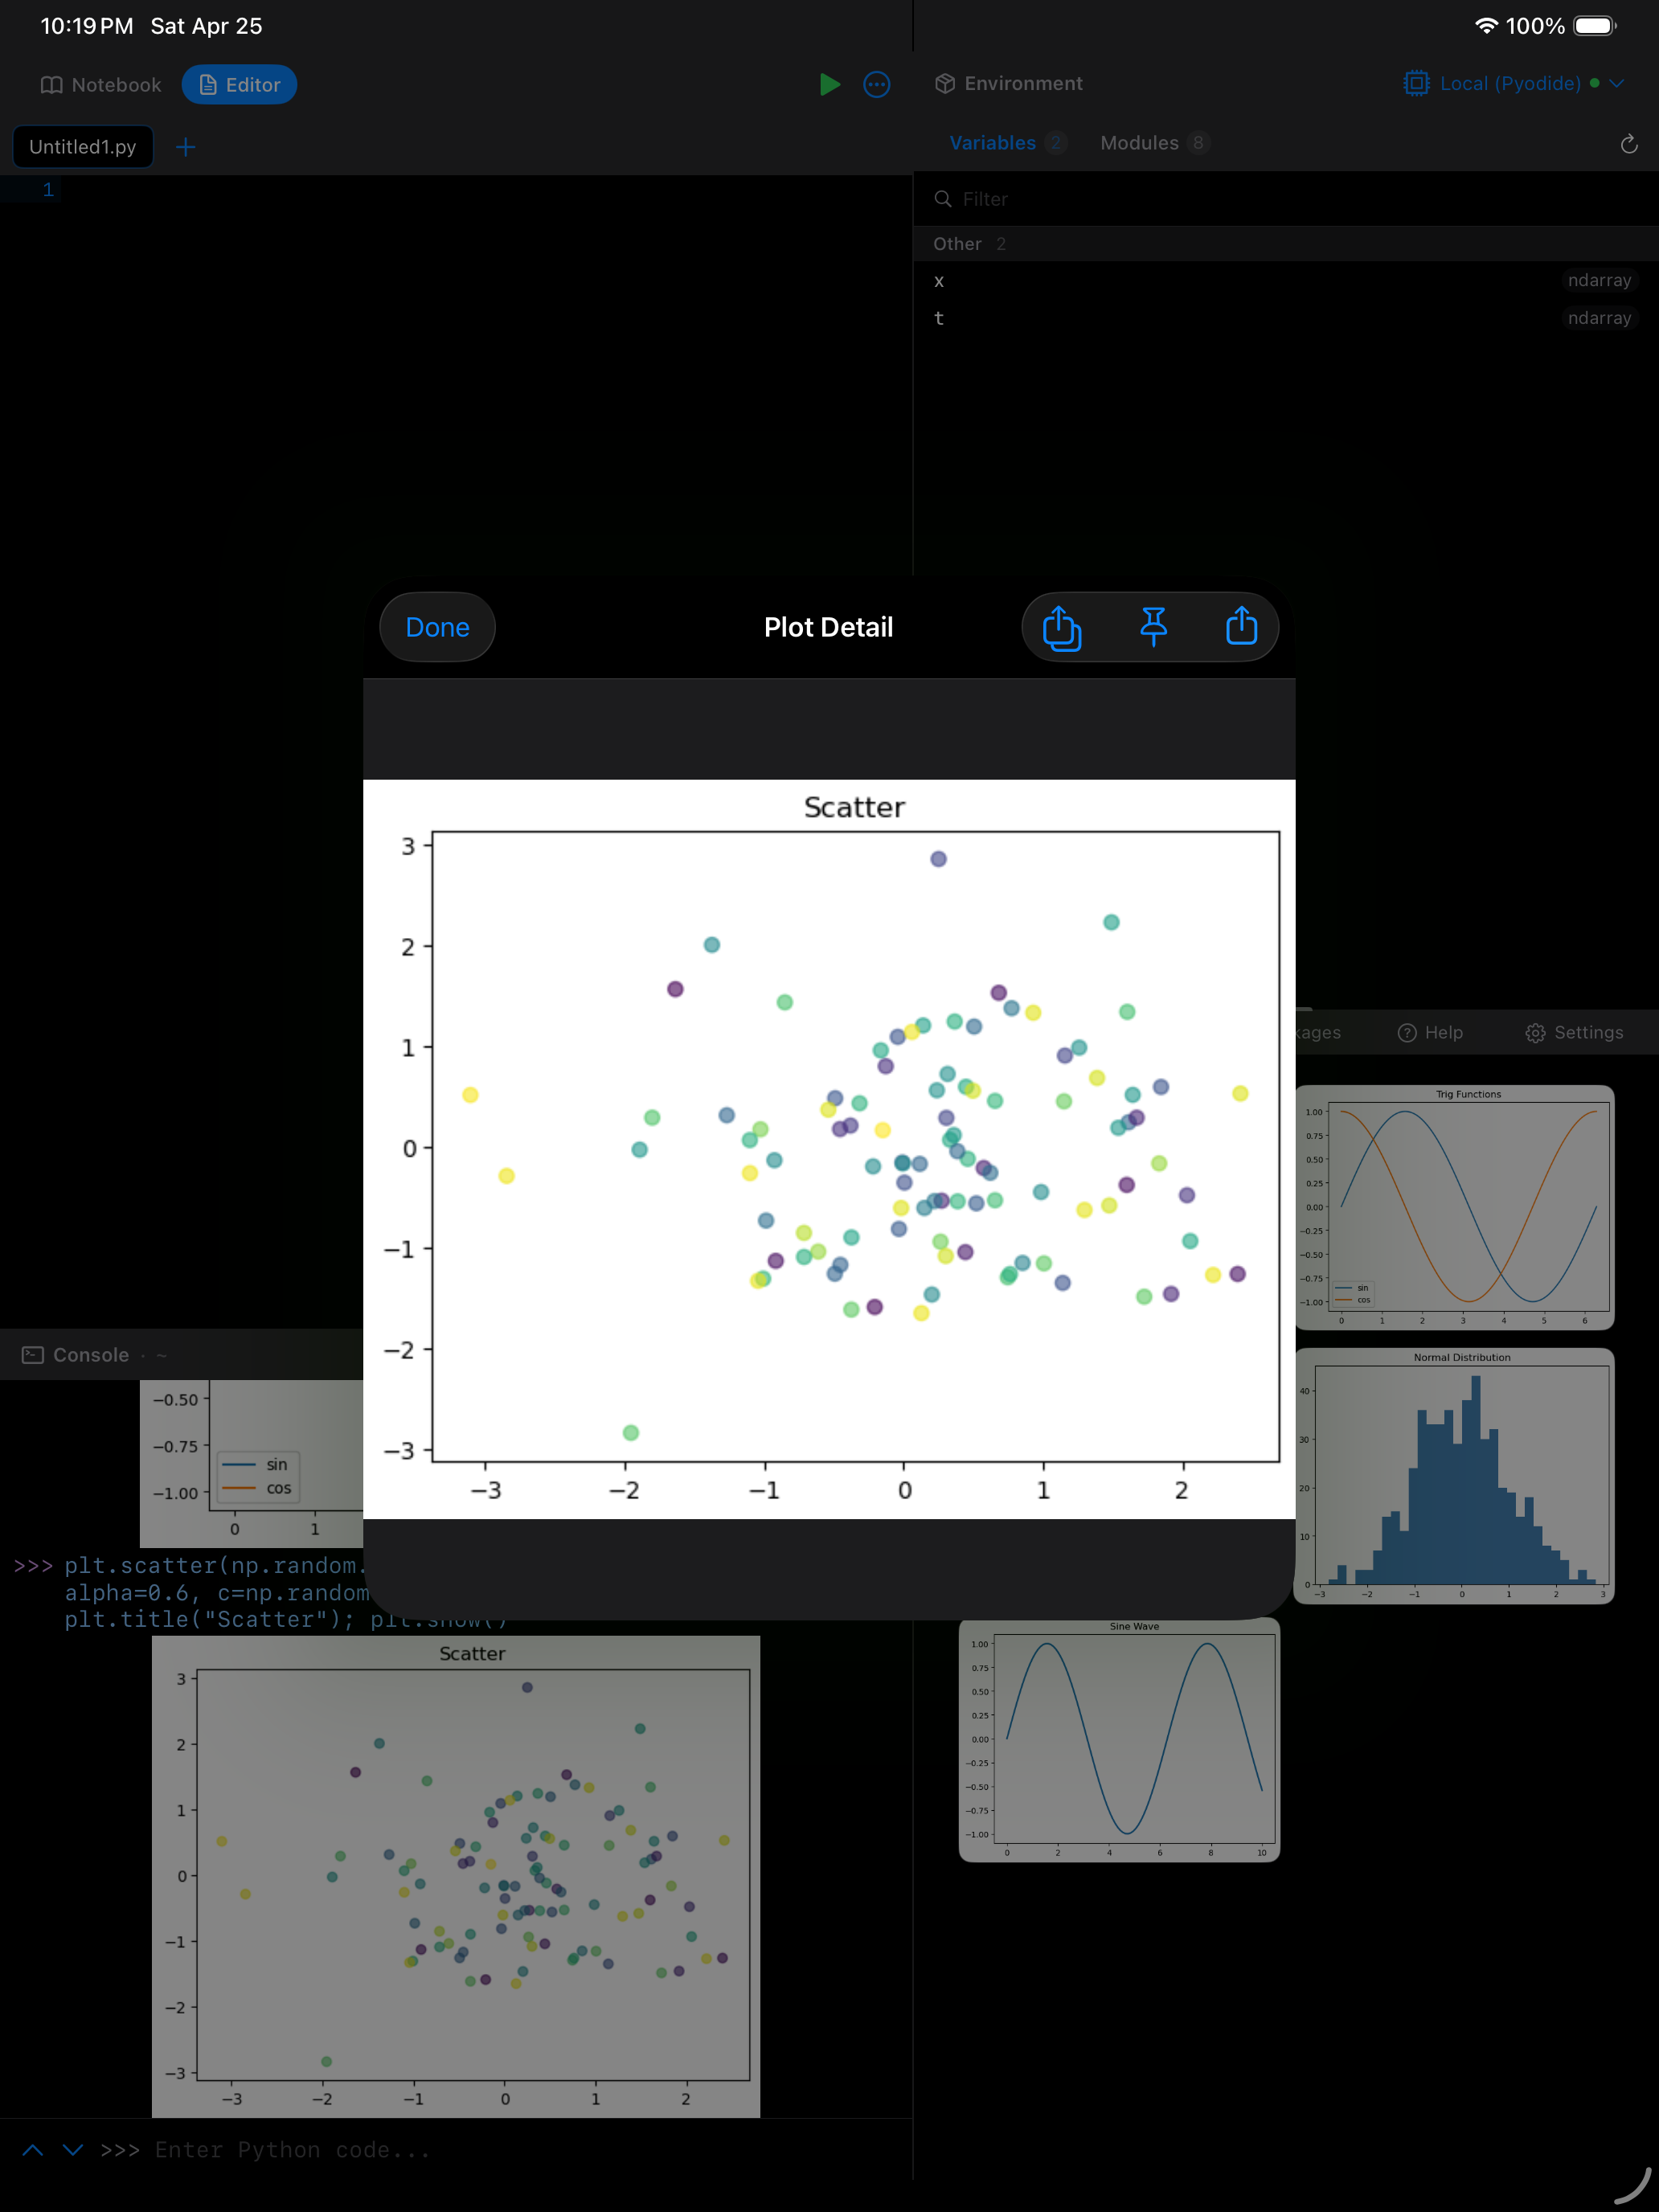
Left: Full-screen plot detail view with pinch-to-zoom support. Right: Export menu with format and filename options.
Long-pressing a plot thumbnail in the gallery also gives you a quick Share option without needing to open the detail view first.
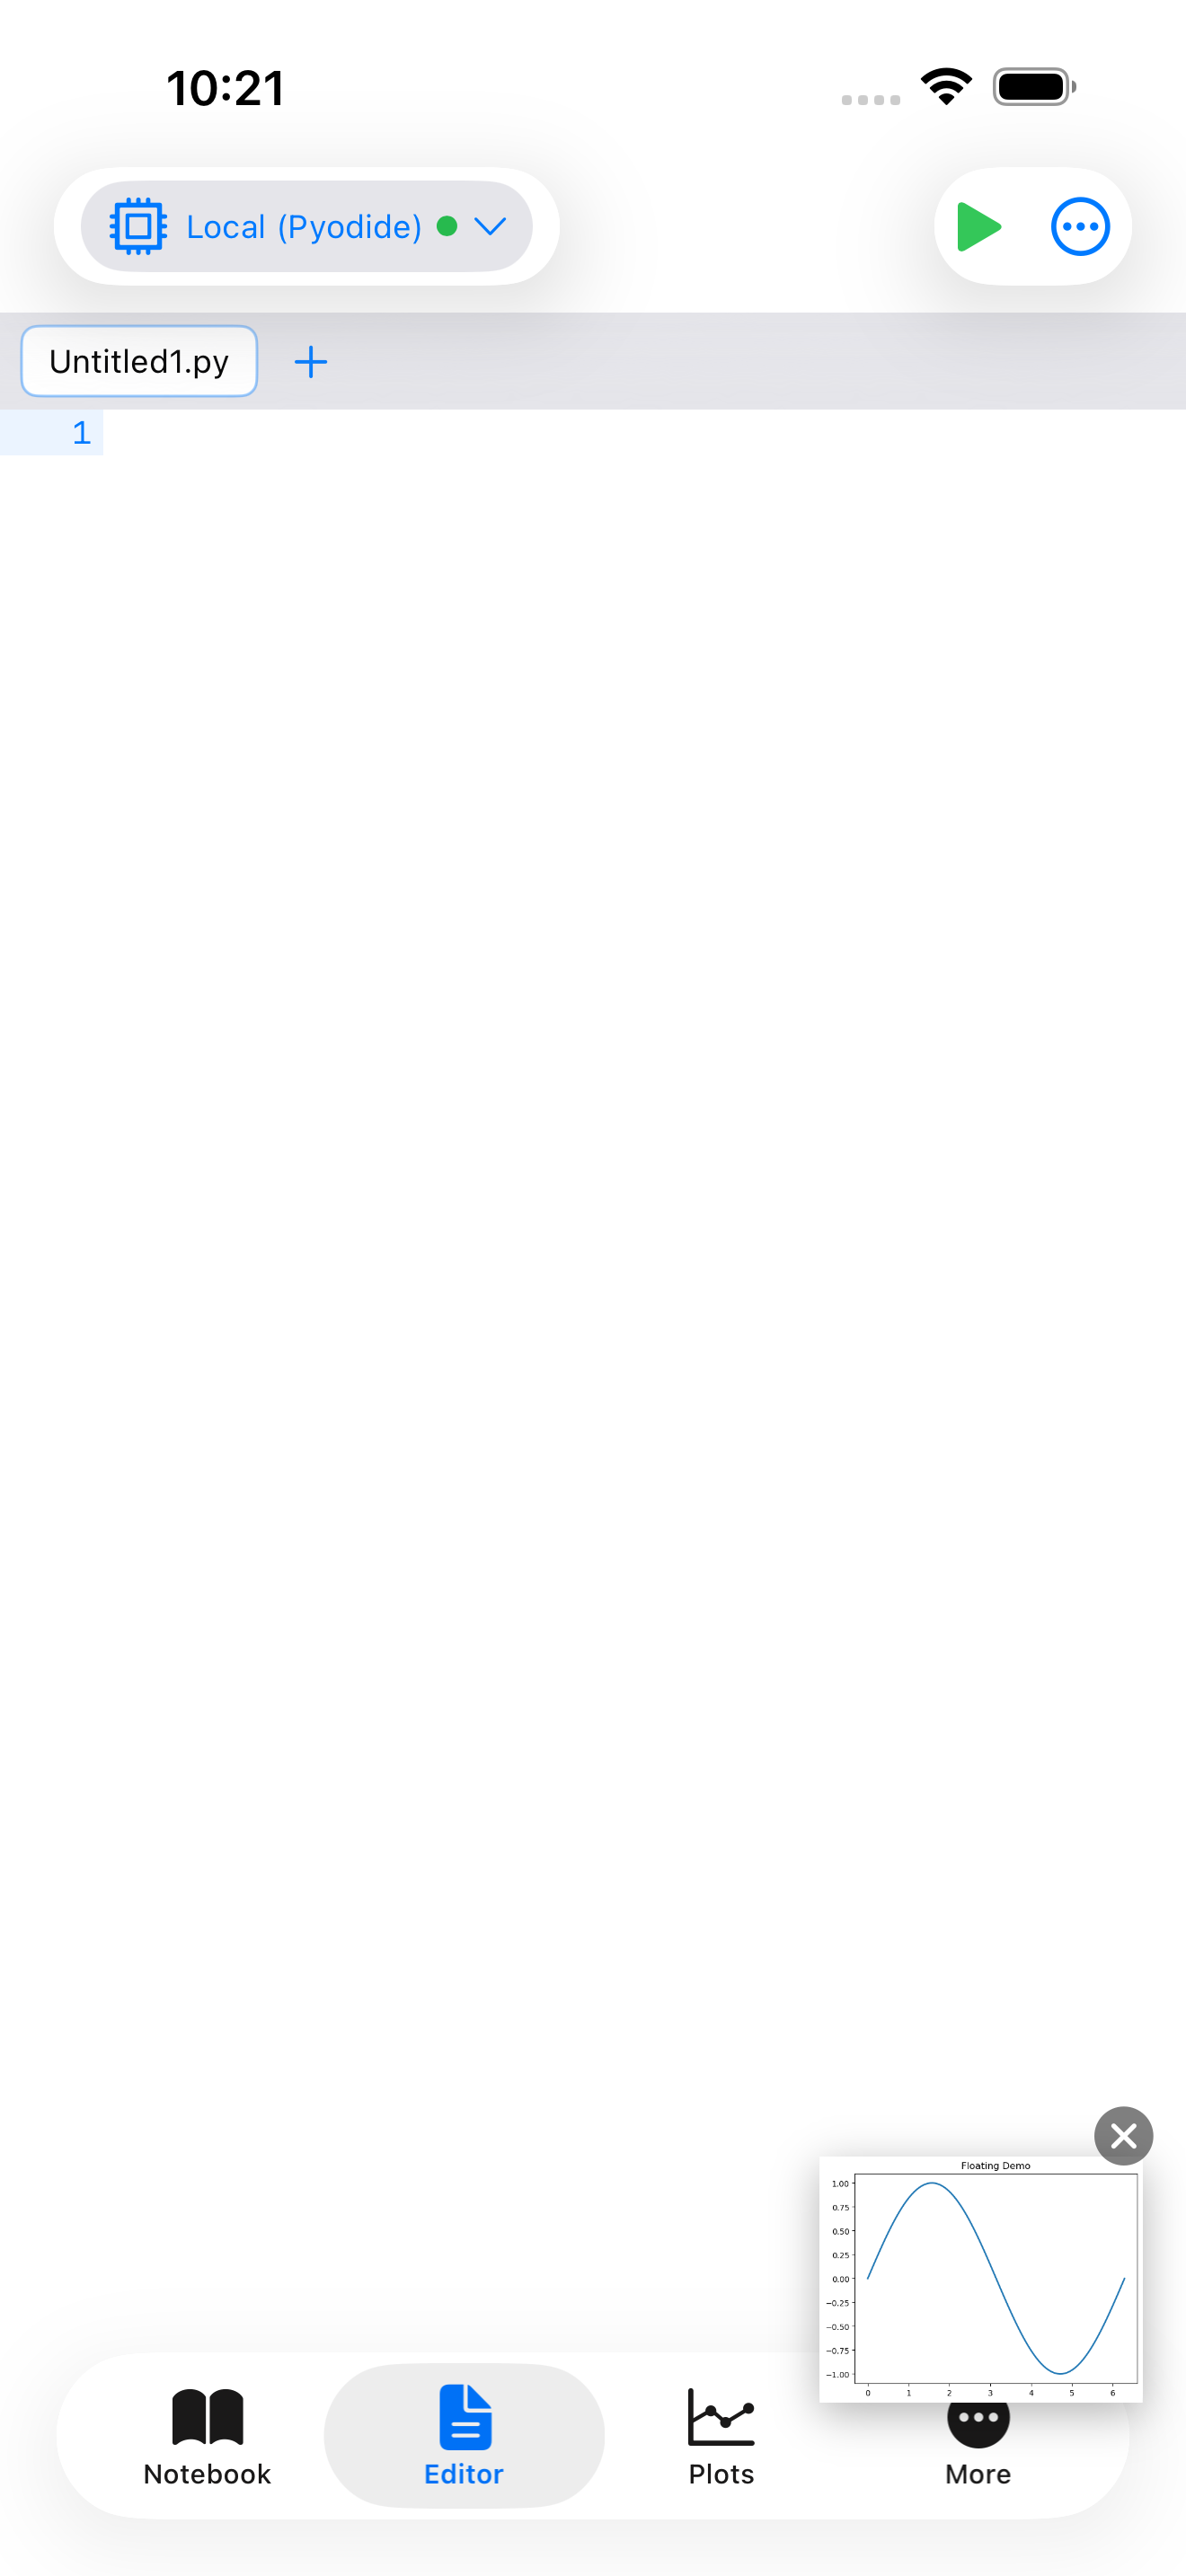
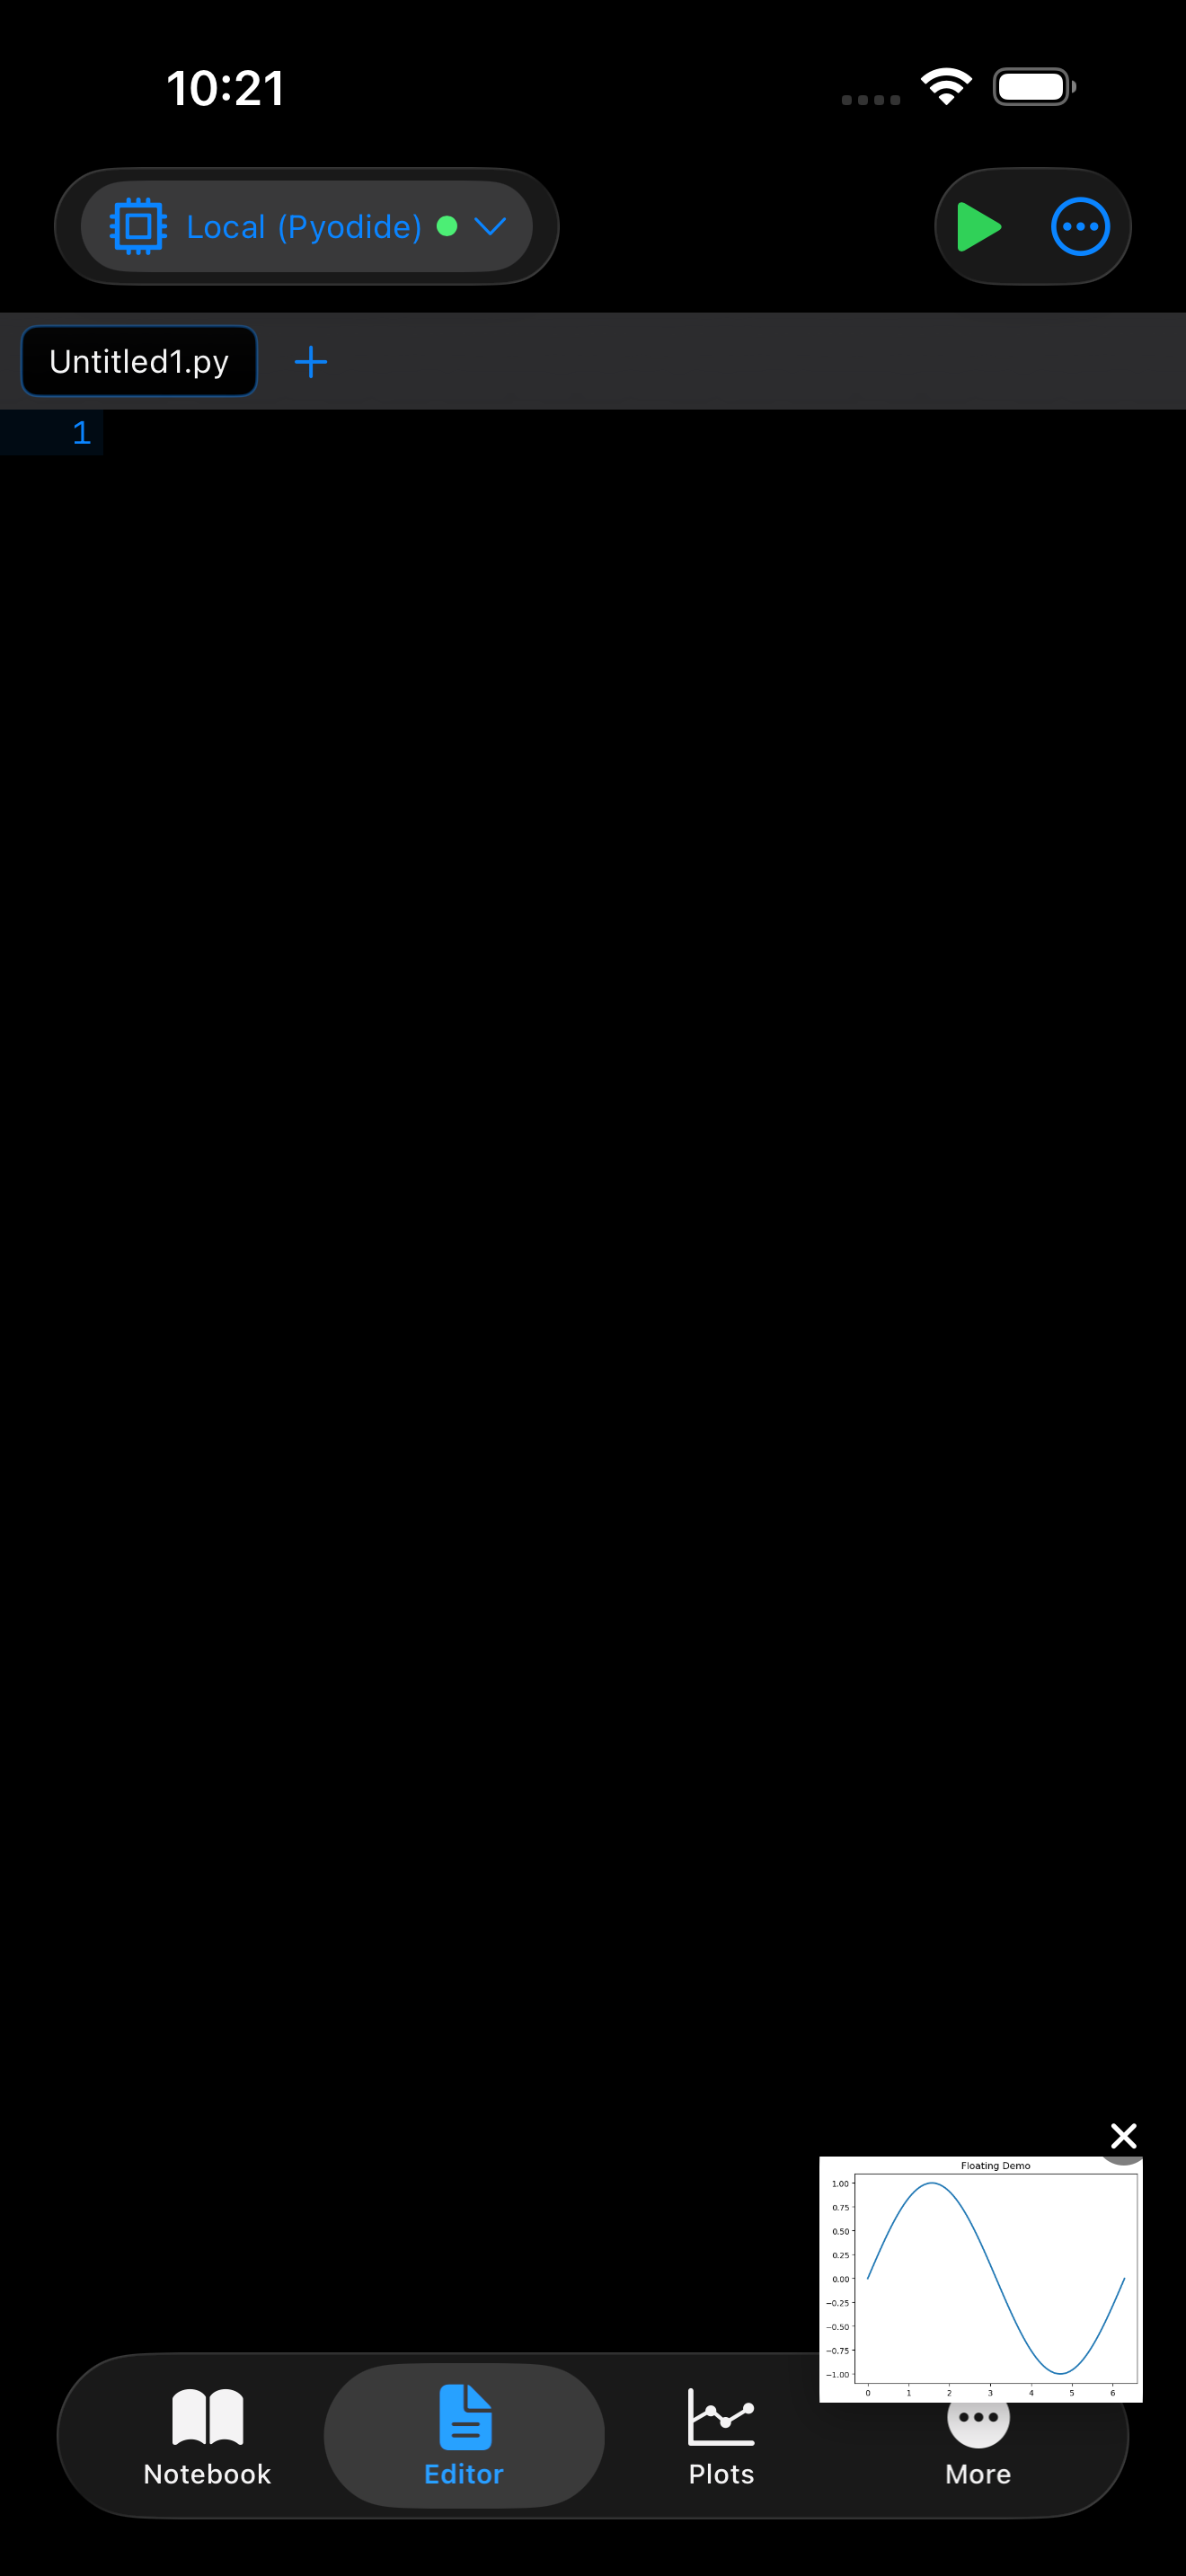
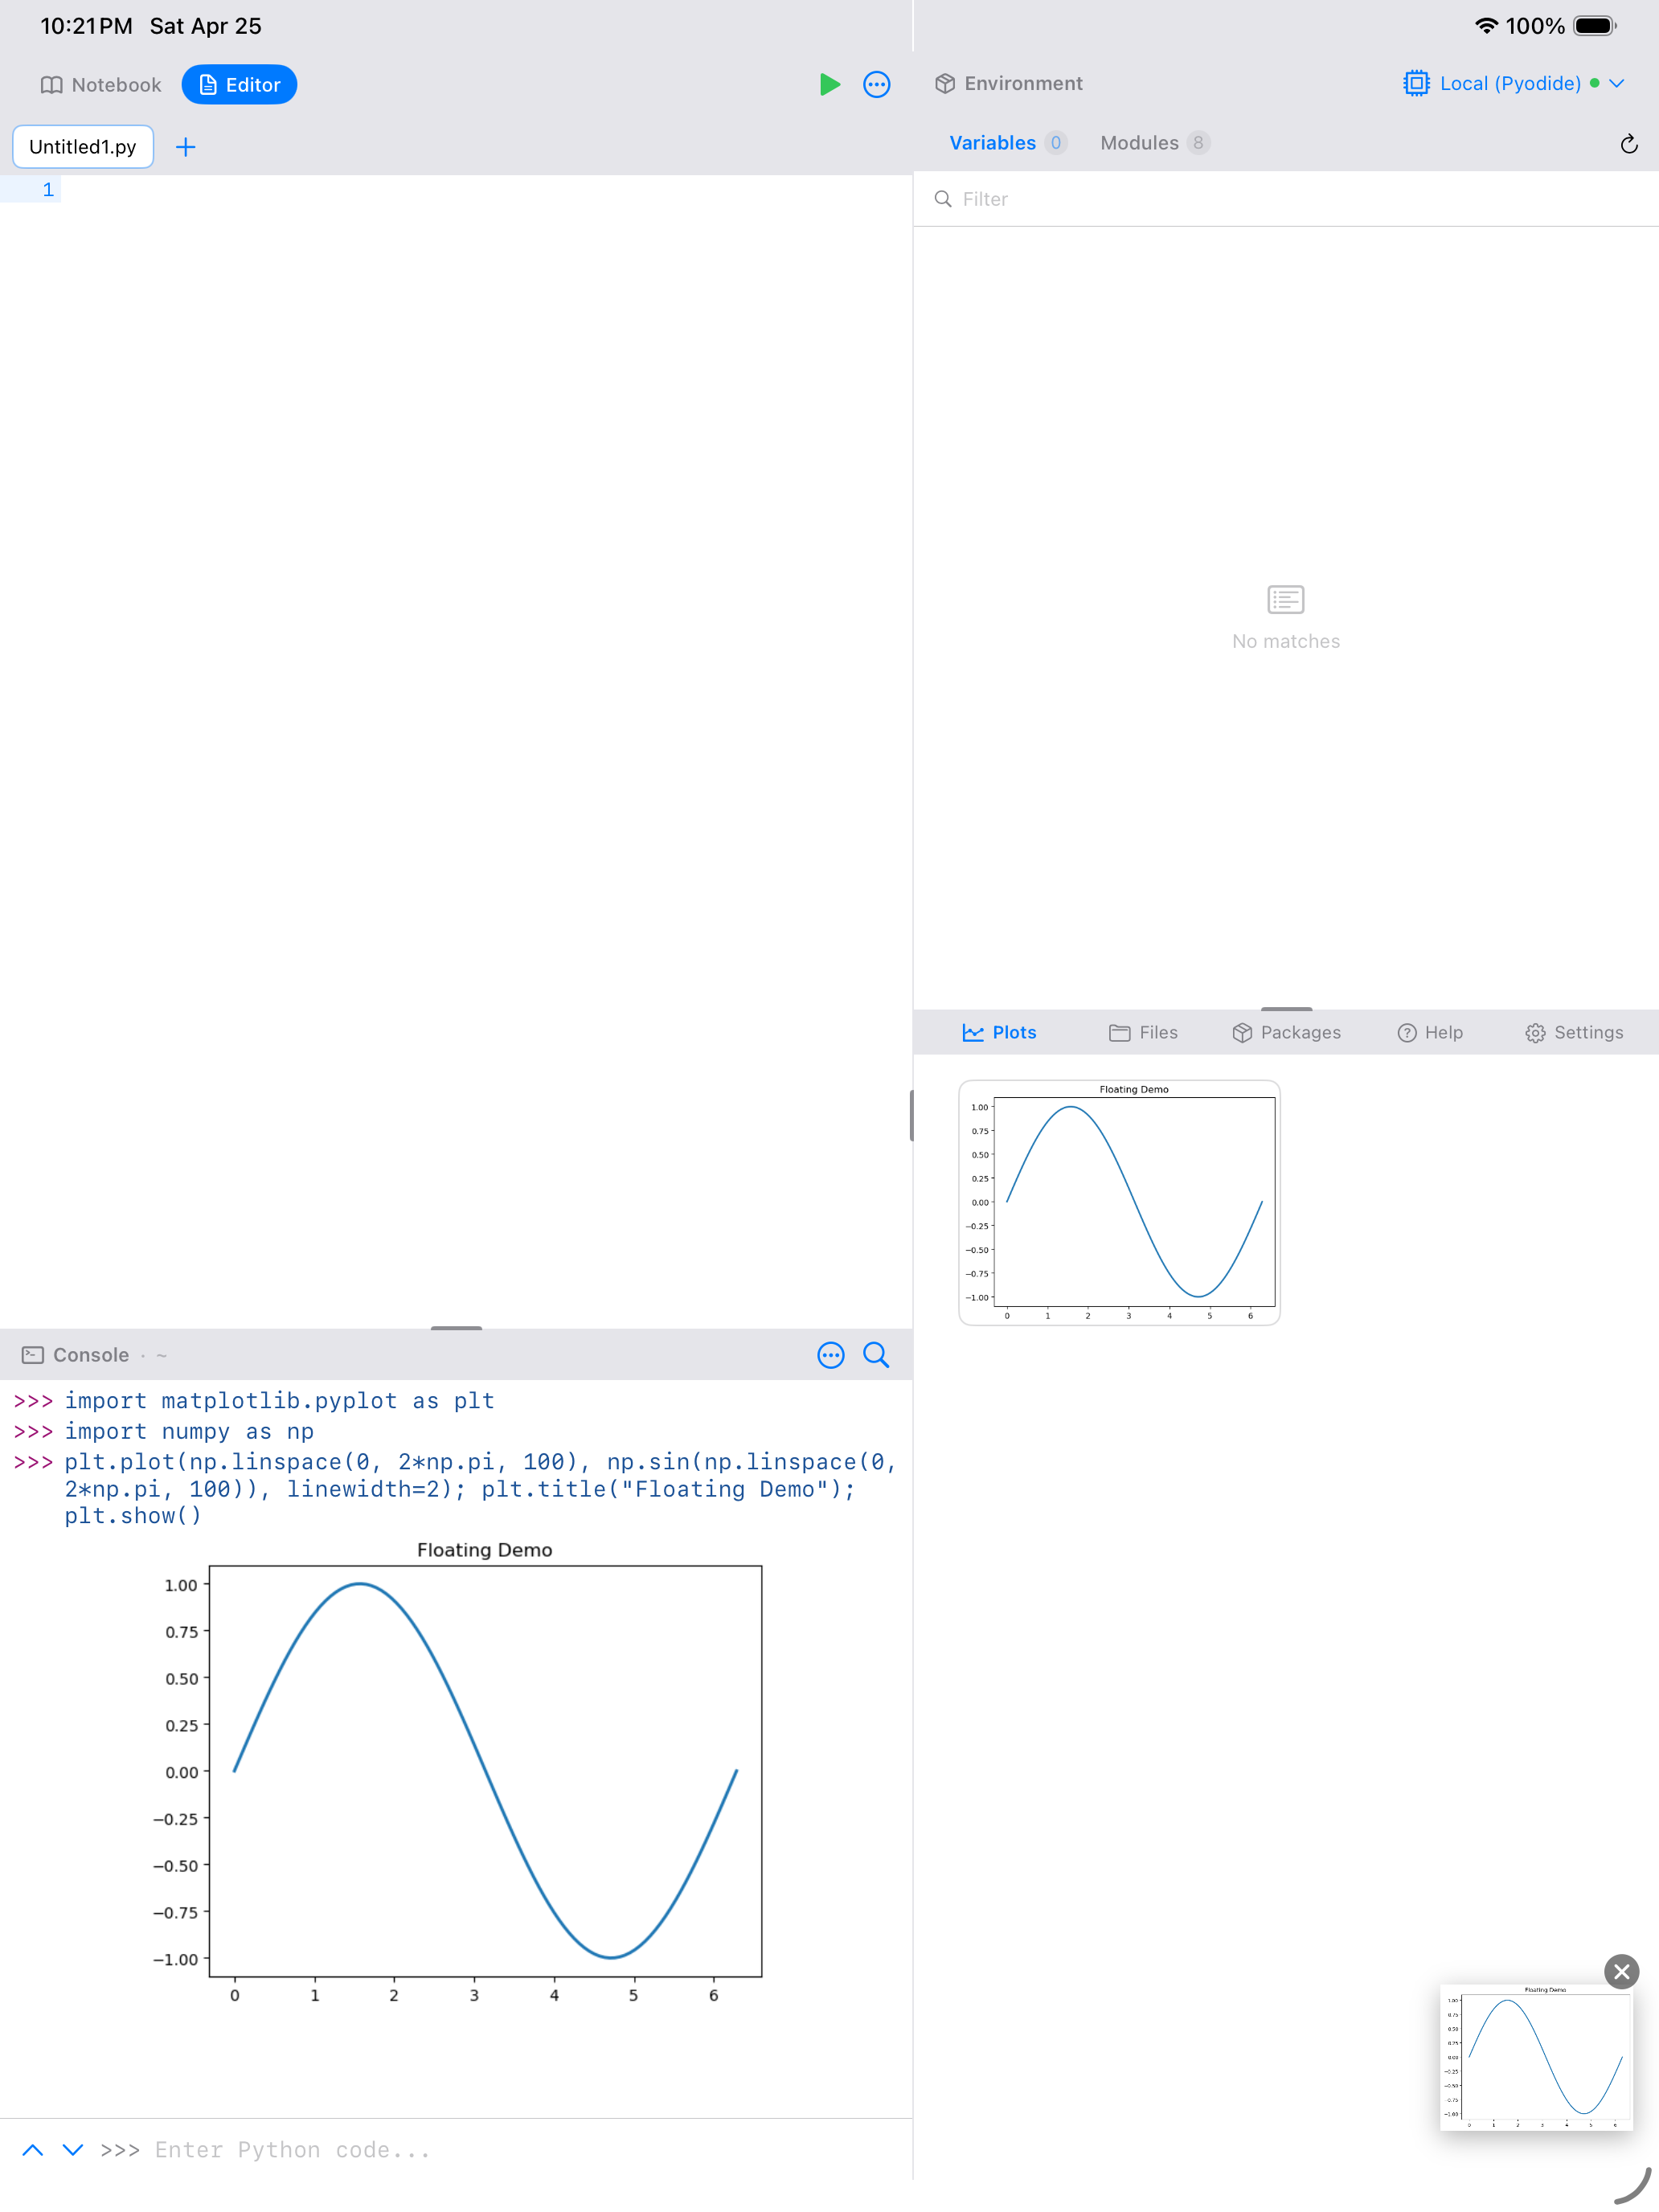
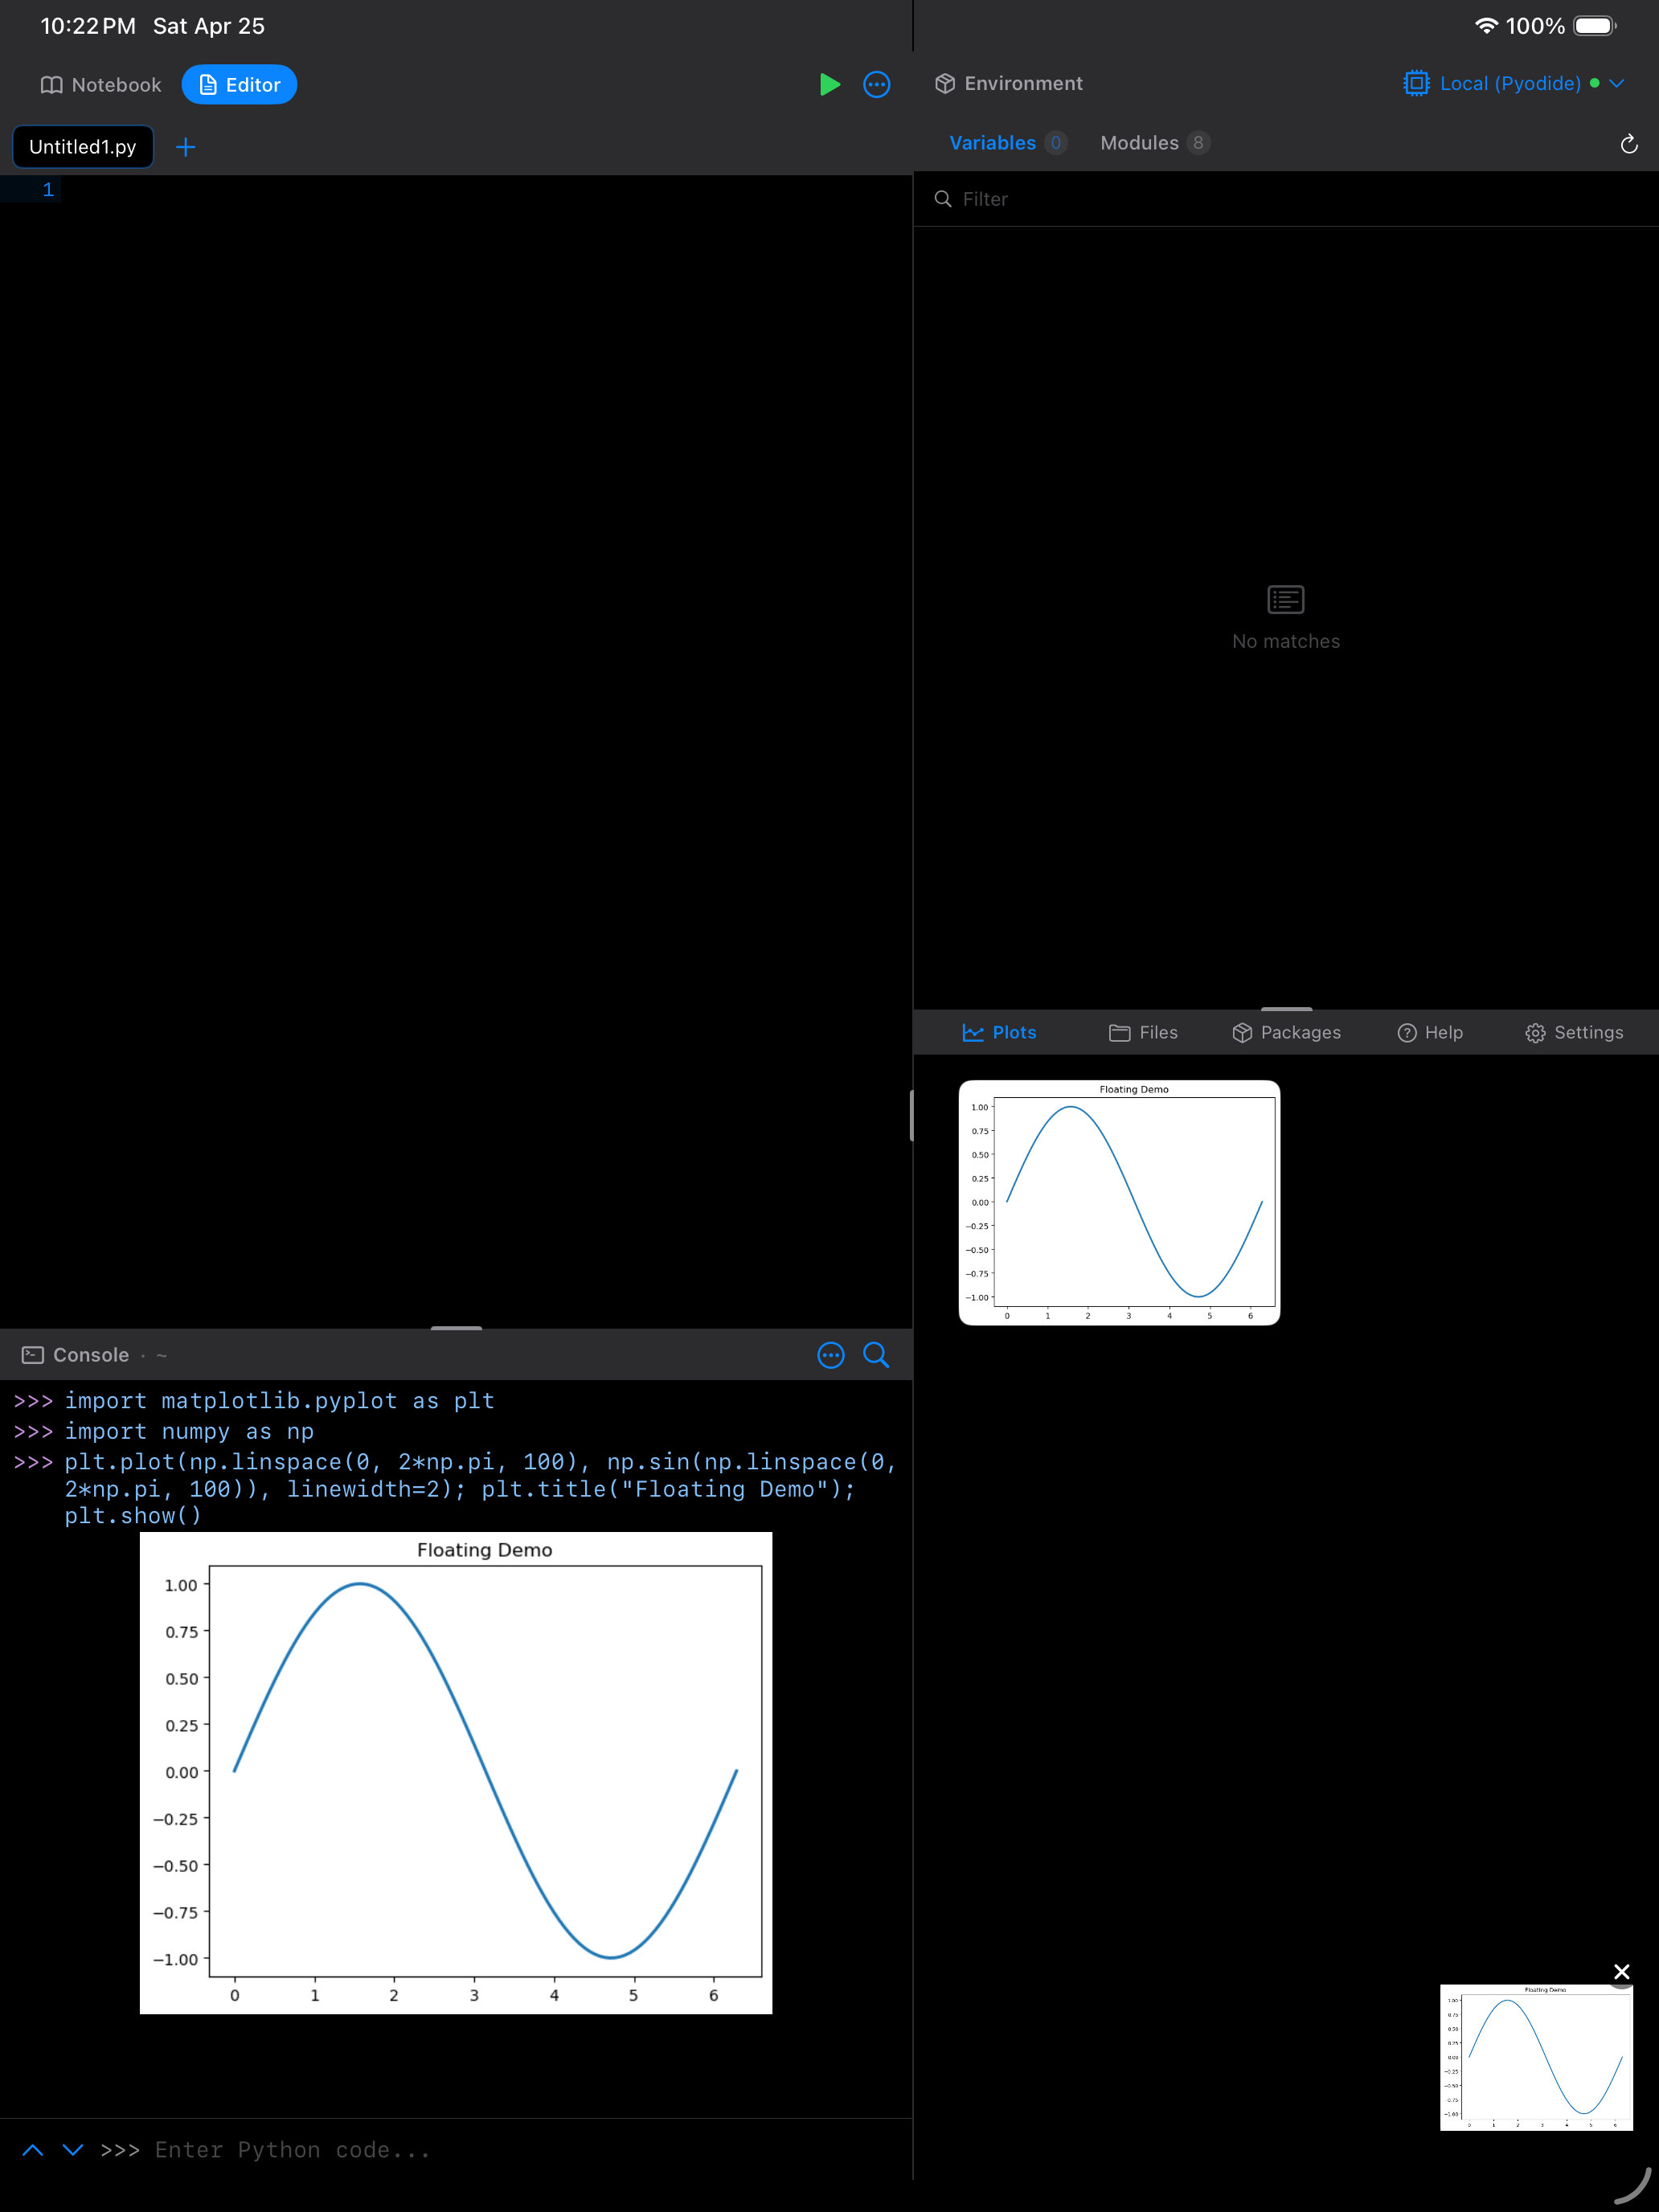
Floating Plot Overlay
While you are coding in the Editor or Console, a small floating plot preview can appear in the corner of the screen whenever a new plot is generated. This lets you see the result of your plotting code without switching to the Plots tab. Tap the overlay to expand it to full size, or dismiss it to keep working. Enable it from Settings > Plots > Display Mode.
iPad Features
On iPad, you can open plots in detached windows using iPadOS multi-window support. This lets you have your code in one window and a plot in another, side by side. This is especially useful when you are iterating on a visualization and want to see the result update next to your code.
Long-press any plot thumbnail in the gallery and choose Open in New Window (also available from the detail view toolbar) to pop the plot out into its own window.
Managing Memory
Plots are stored in the app’s memory and on-device cache. They persist across app launches, but generating many high-resolution plots in a single session can use significant memory. To keep things running smoothly:
- Clear old plots you no longer need by selecting them and tapping Delete, or use Clear All Plots from the … menu
- Pin the plots you want to keep before clearing, so they are protected from deletion
- For memory-intensive work, consider using smaller figure sizes in your matplotlib code (e.g.,
figsize=(6, 4)instead offigsize=(12, 8))
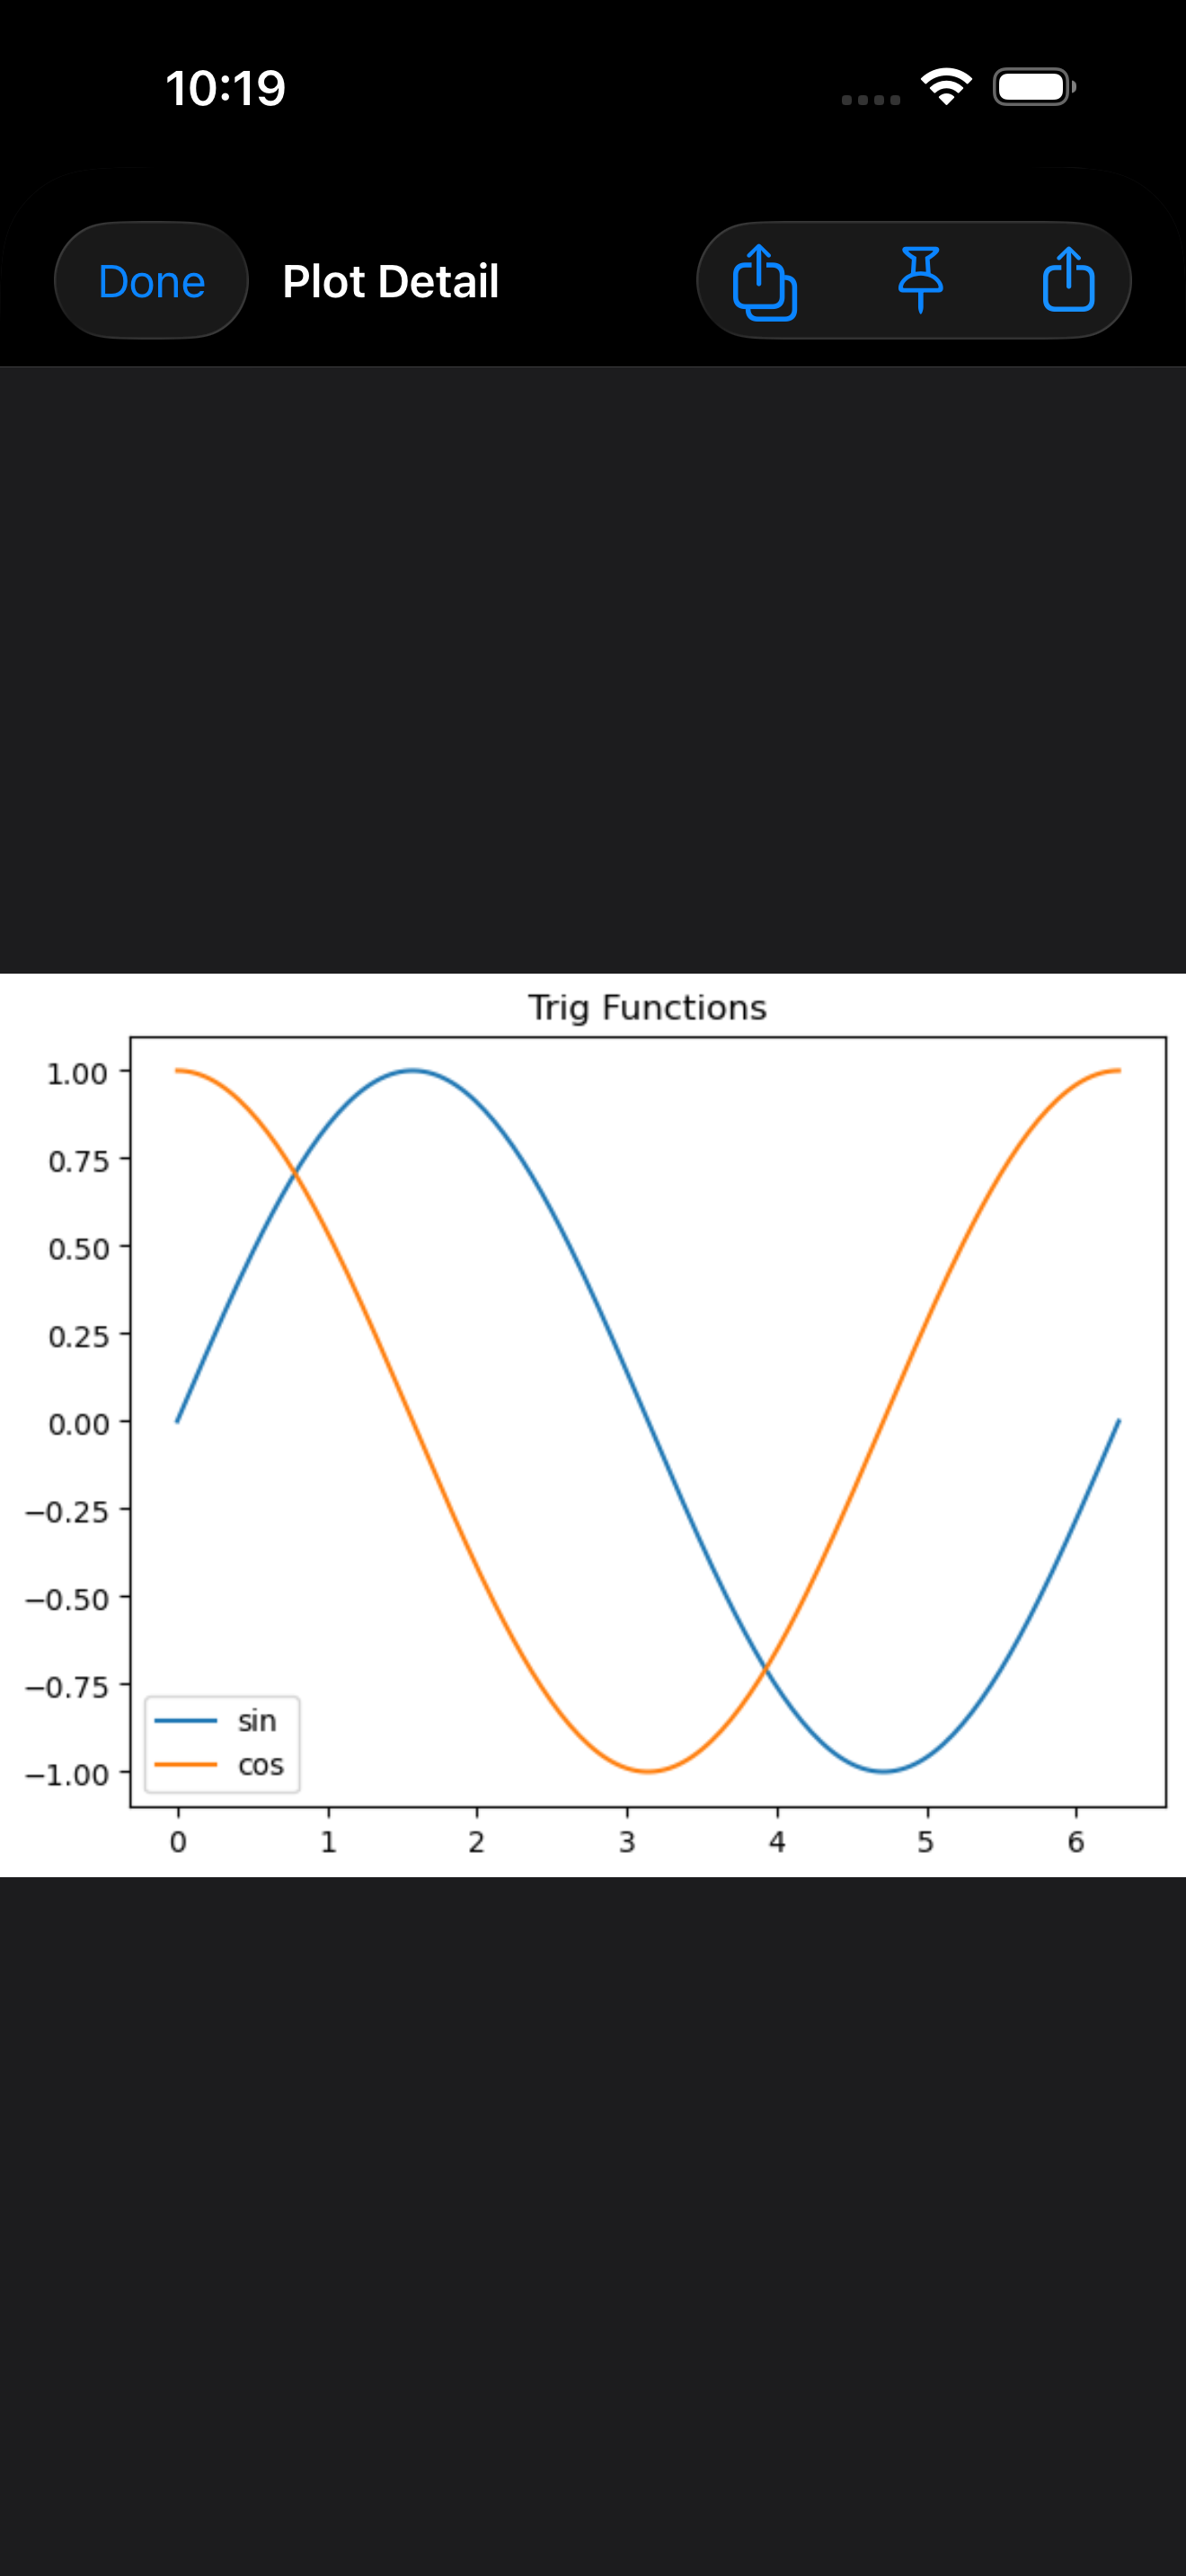
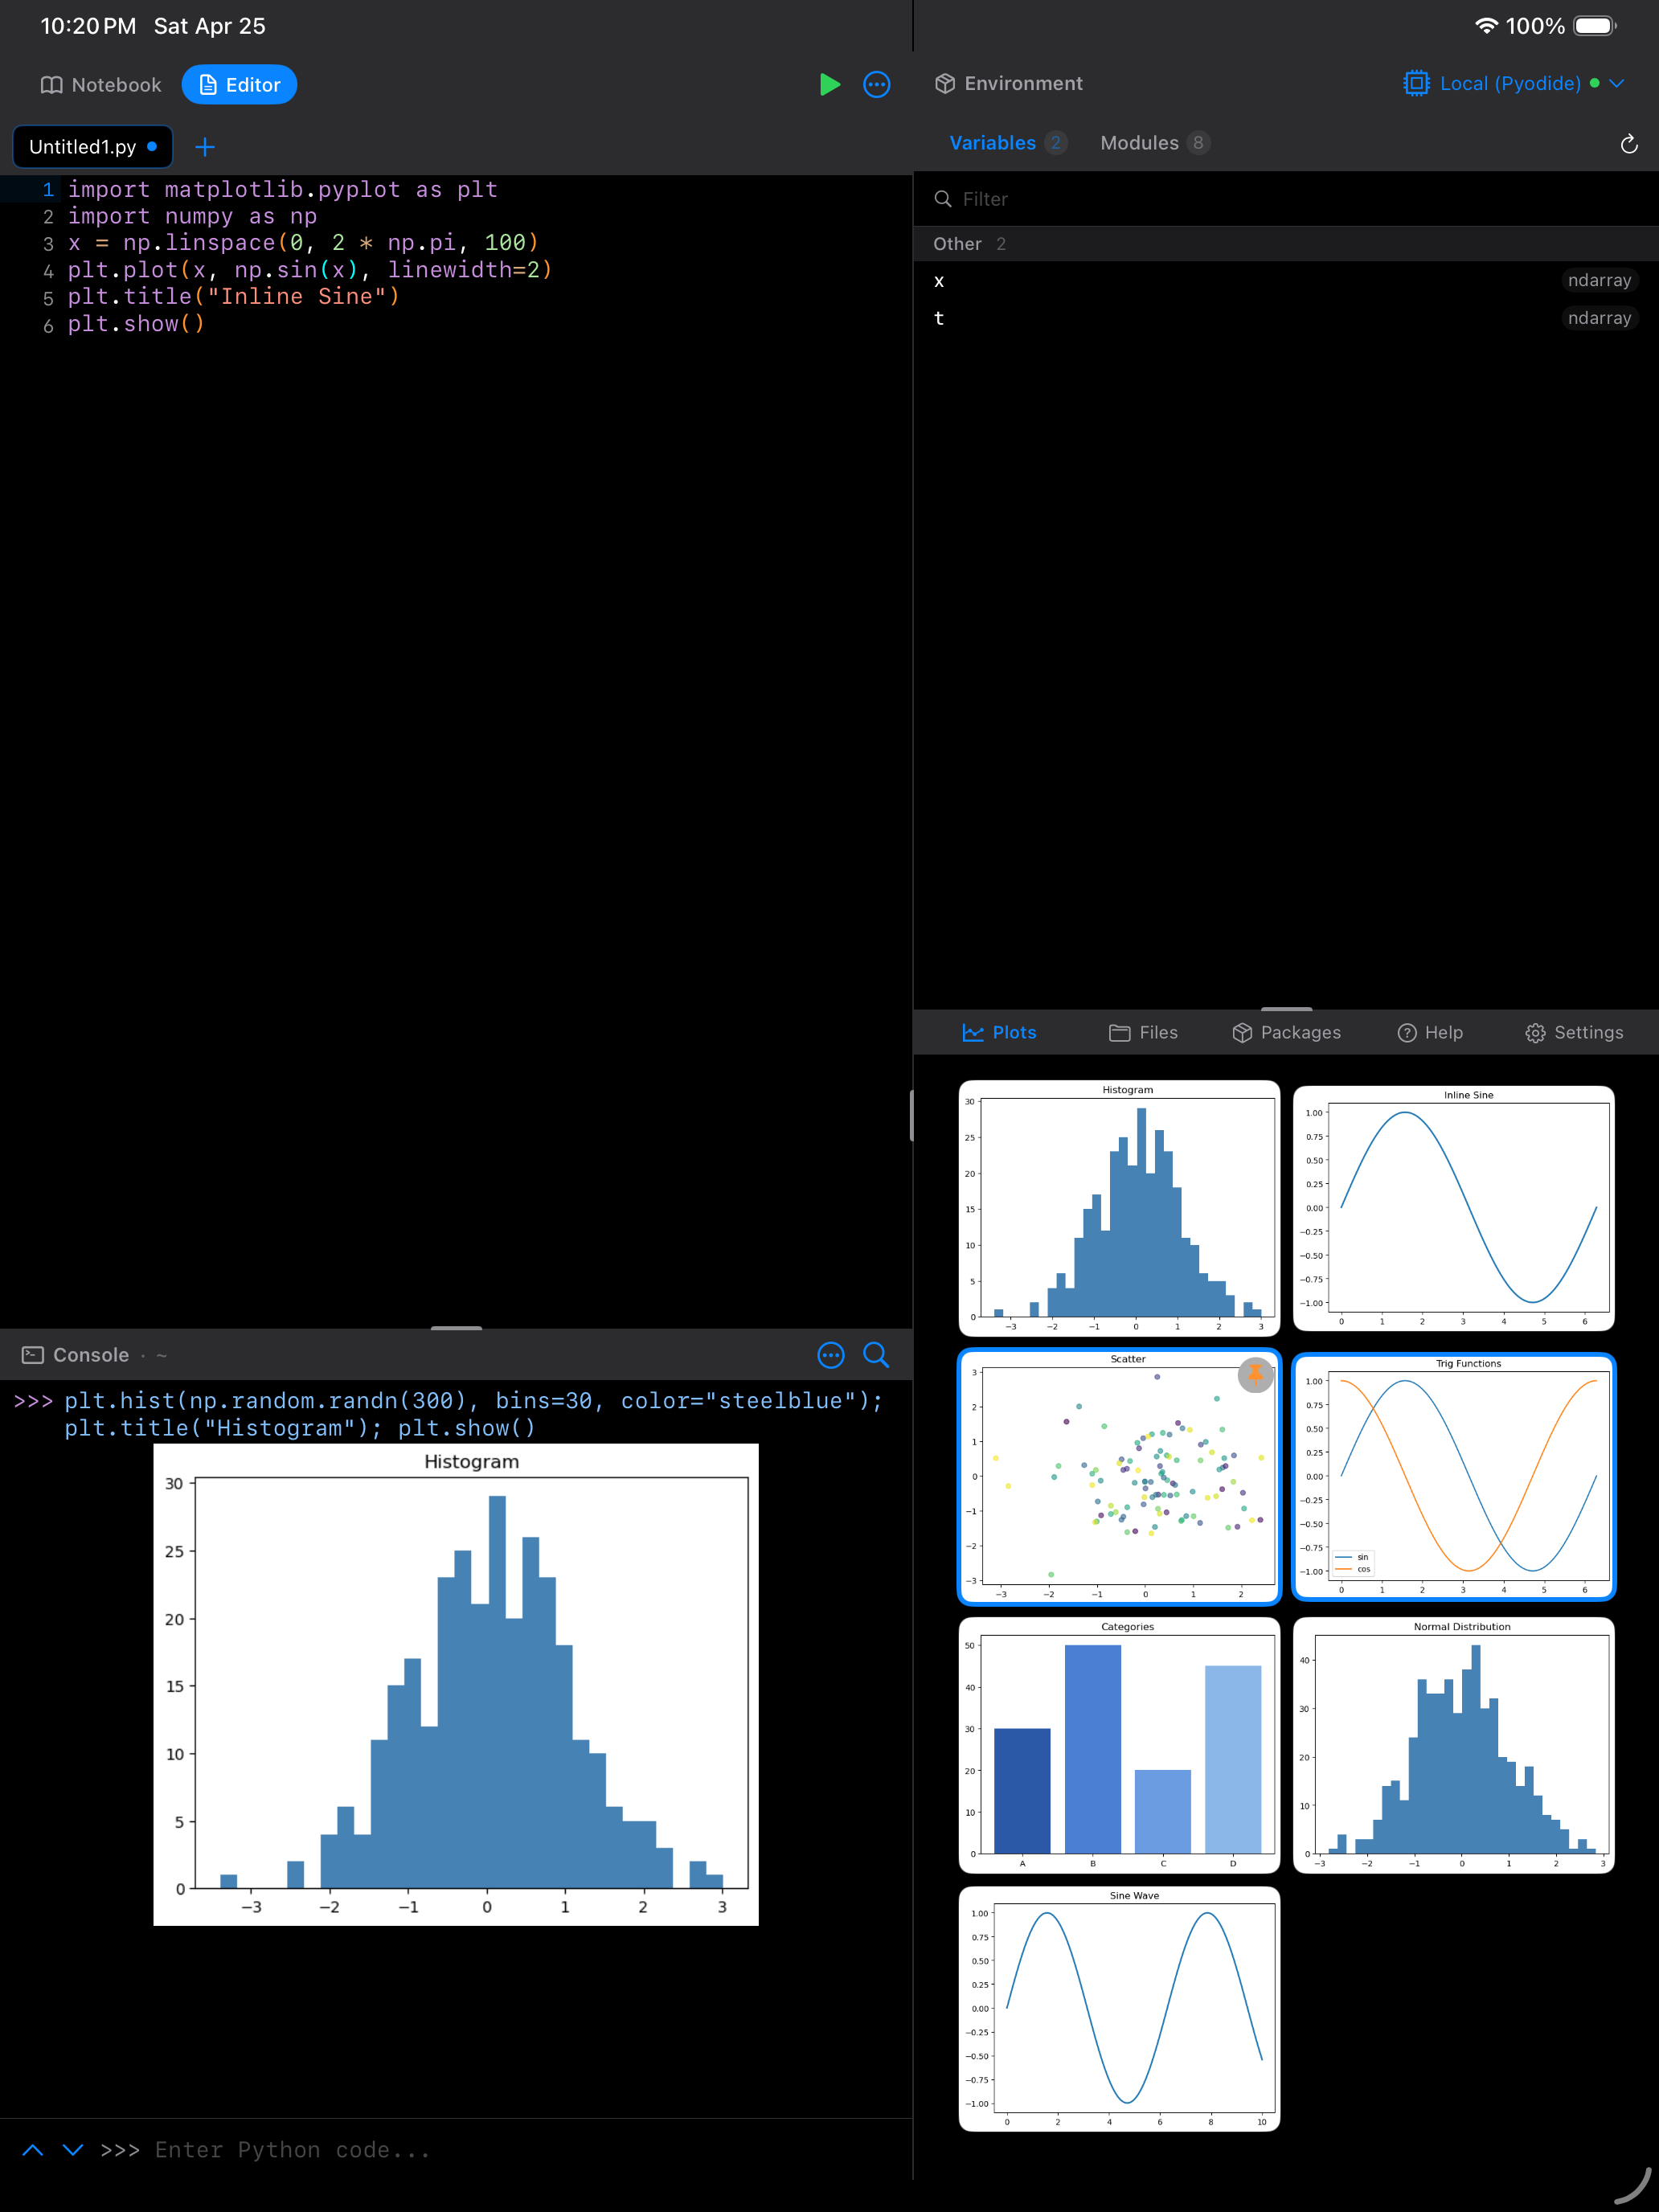
You can change the background color of the plot detail view in Settings. Options include matching your system theme, always white, always dark, or a neutral gray. This is especially useful if your plots have transparent backgrounds and you want to see them against a specific color.