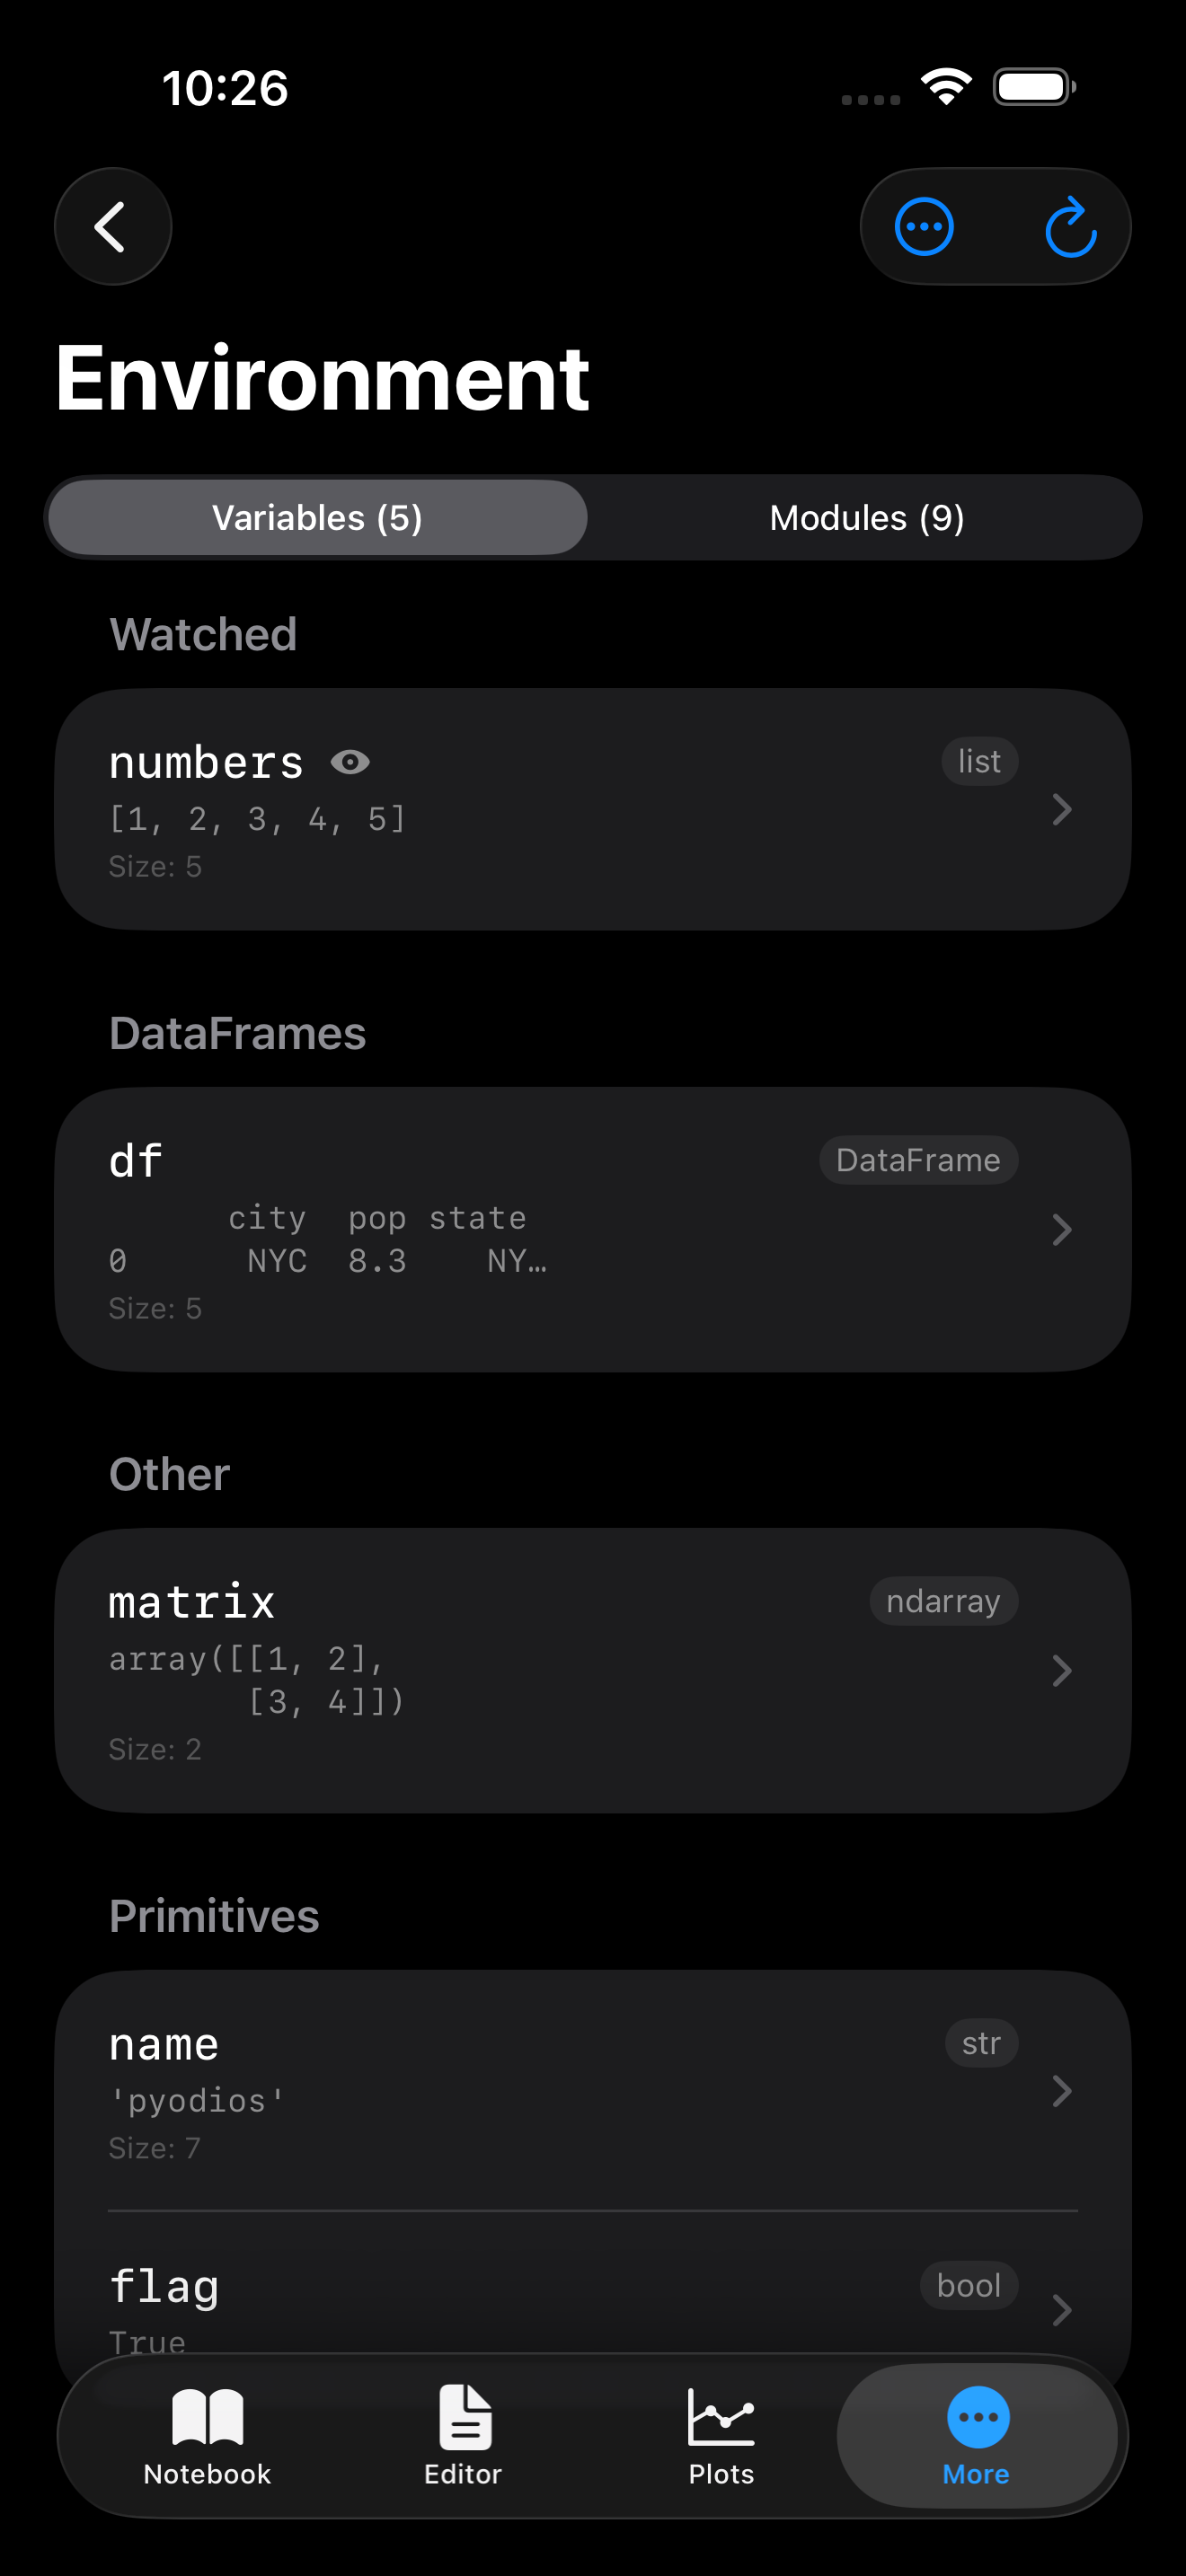
Environment
The Environment tab is your window into what Python is holding in memory. Instead of typing dir() or print() every time you want to check on a variable, you can just switch to Environment and see everything at a glance: names, types, sizes, and short previews of what each object contains.
Your variables, at a glance
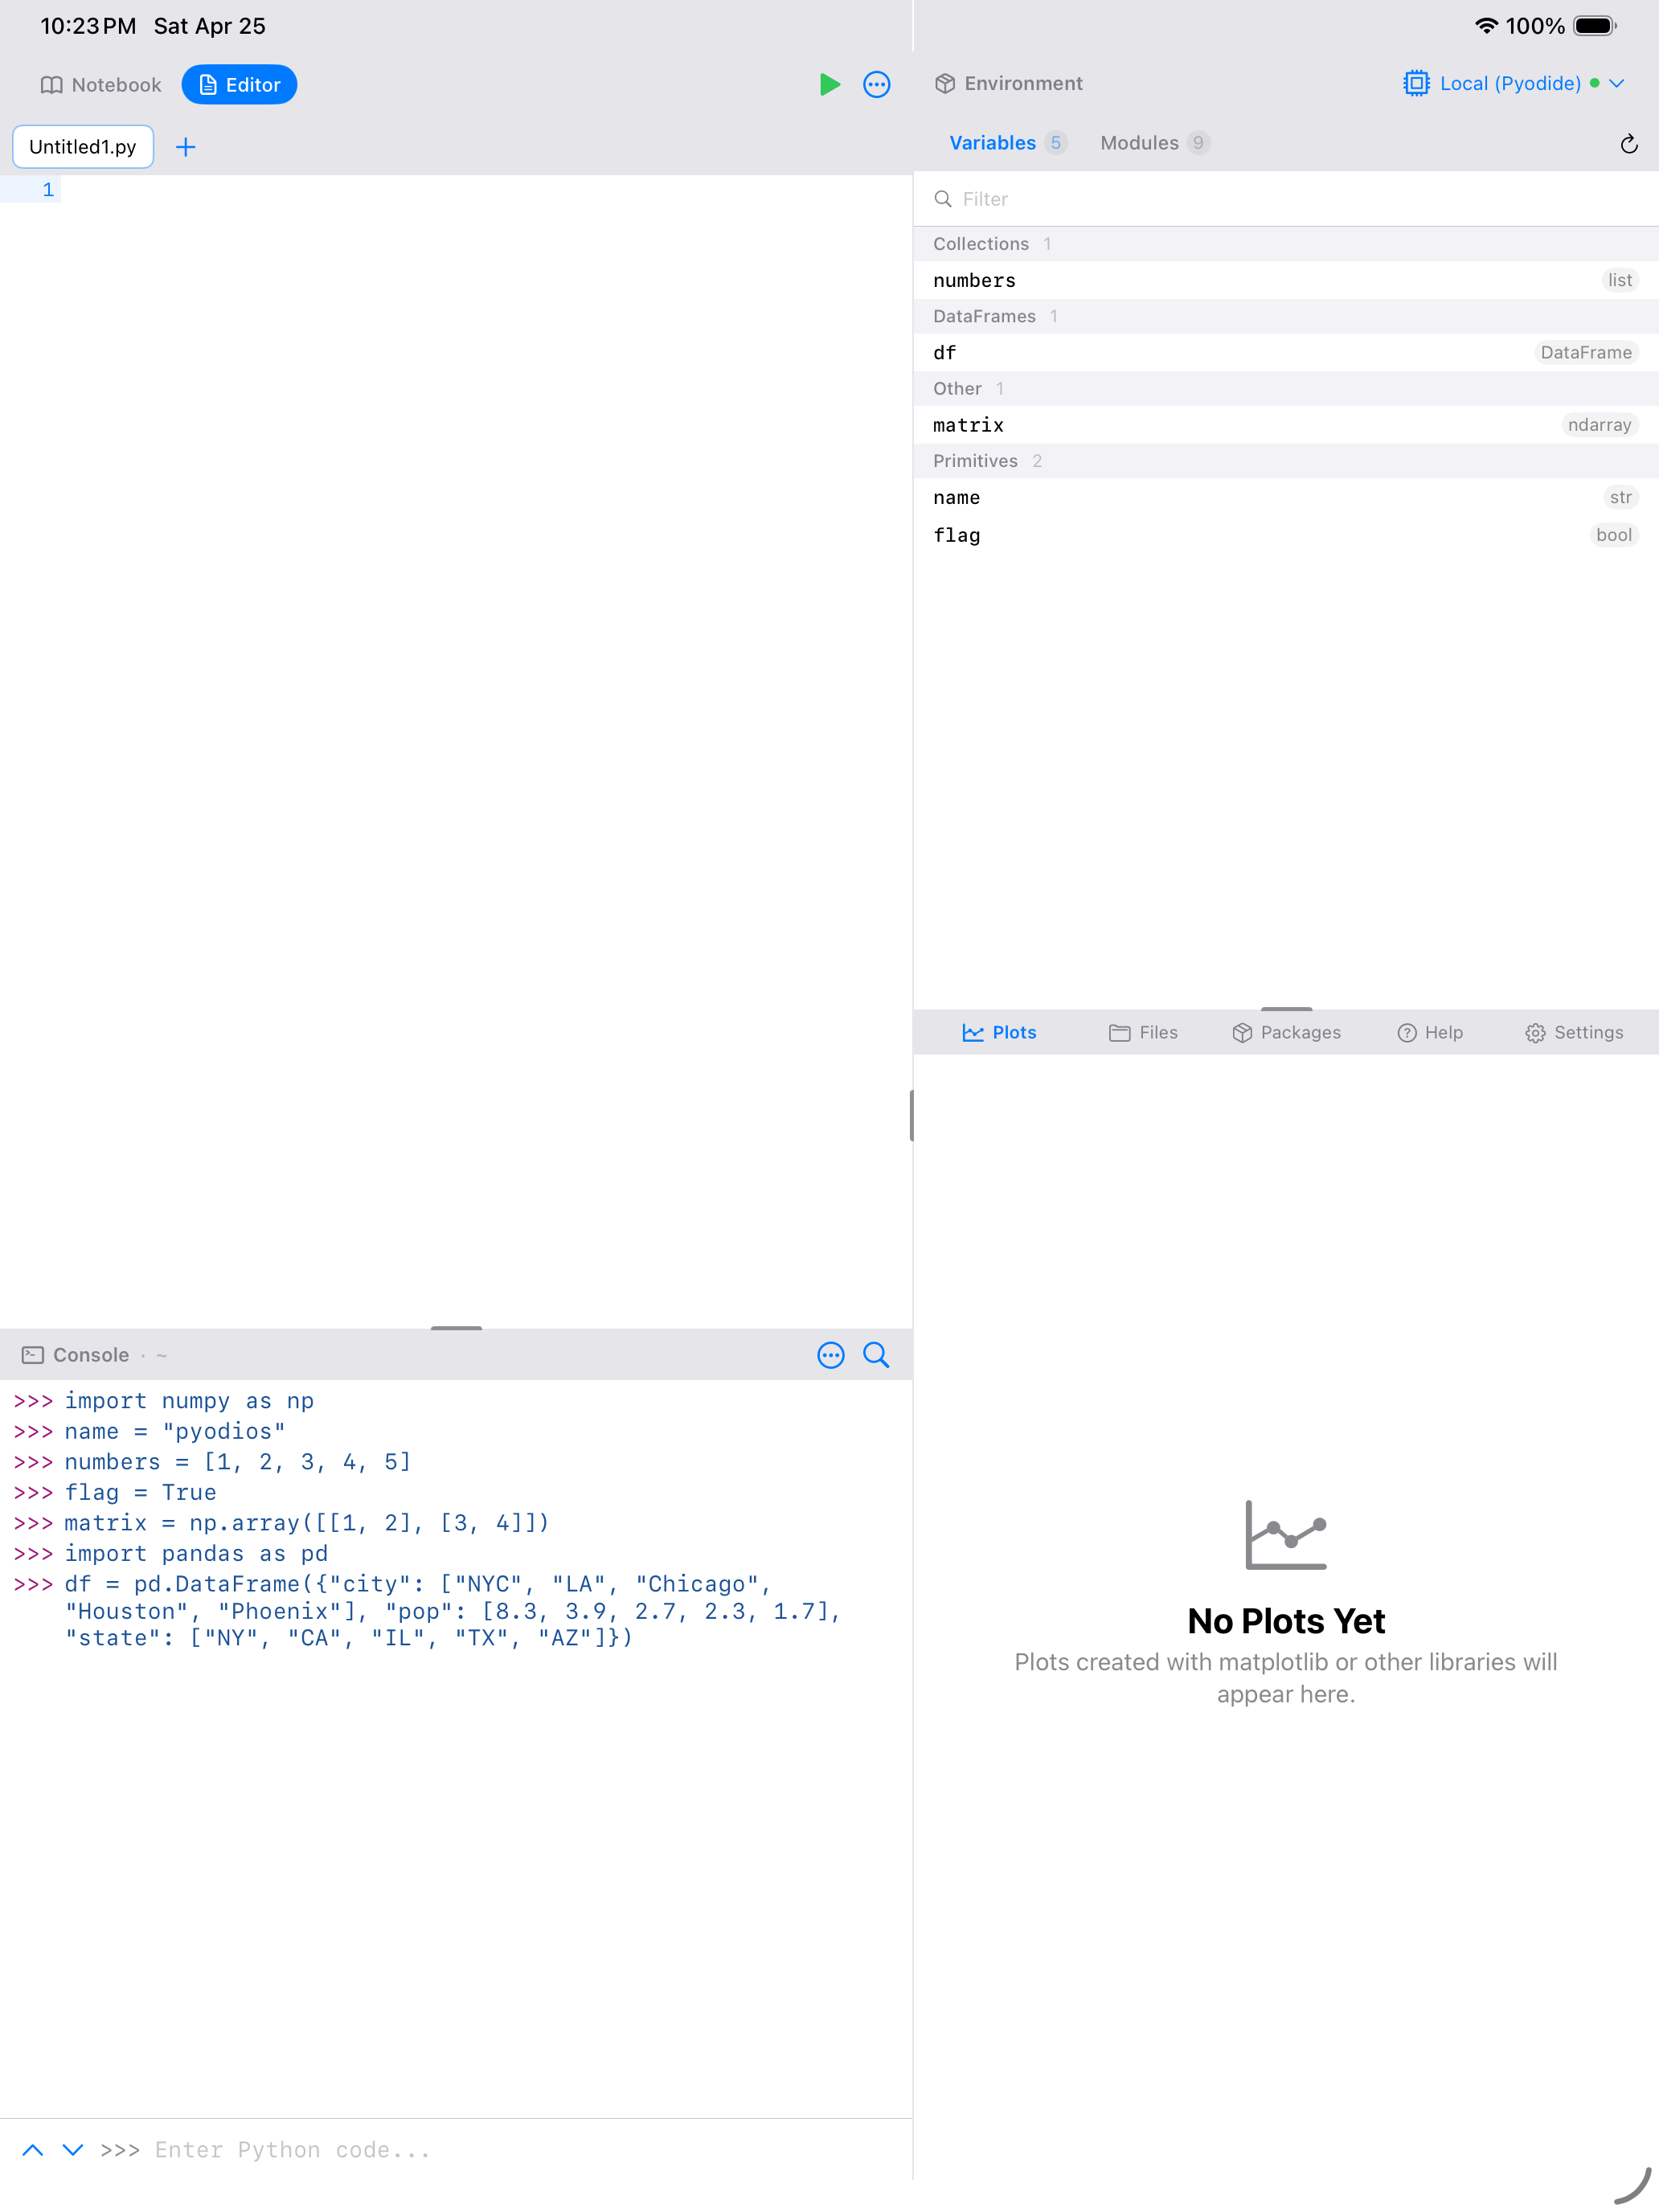
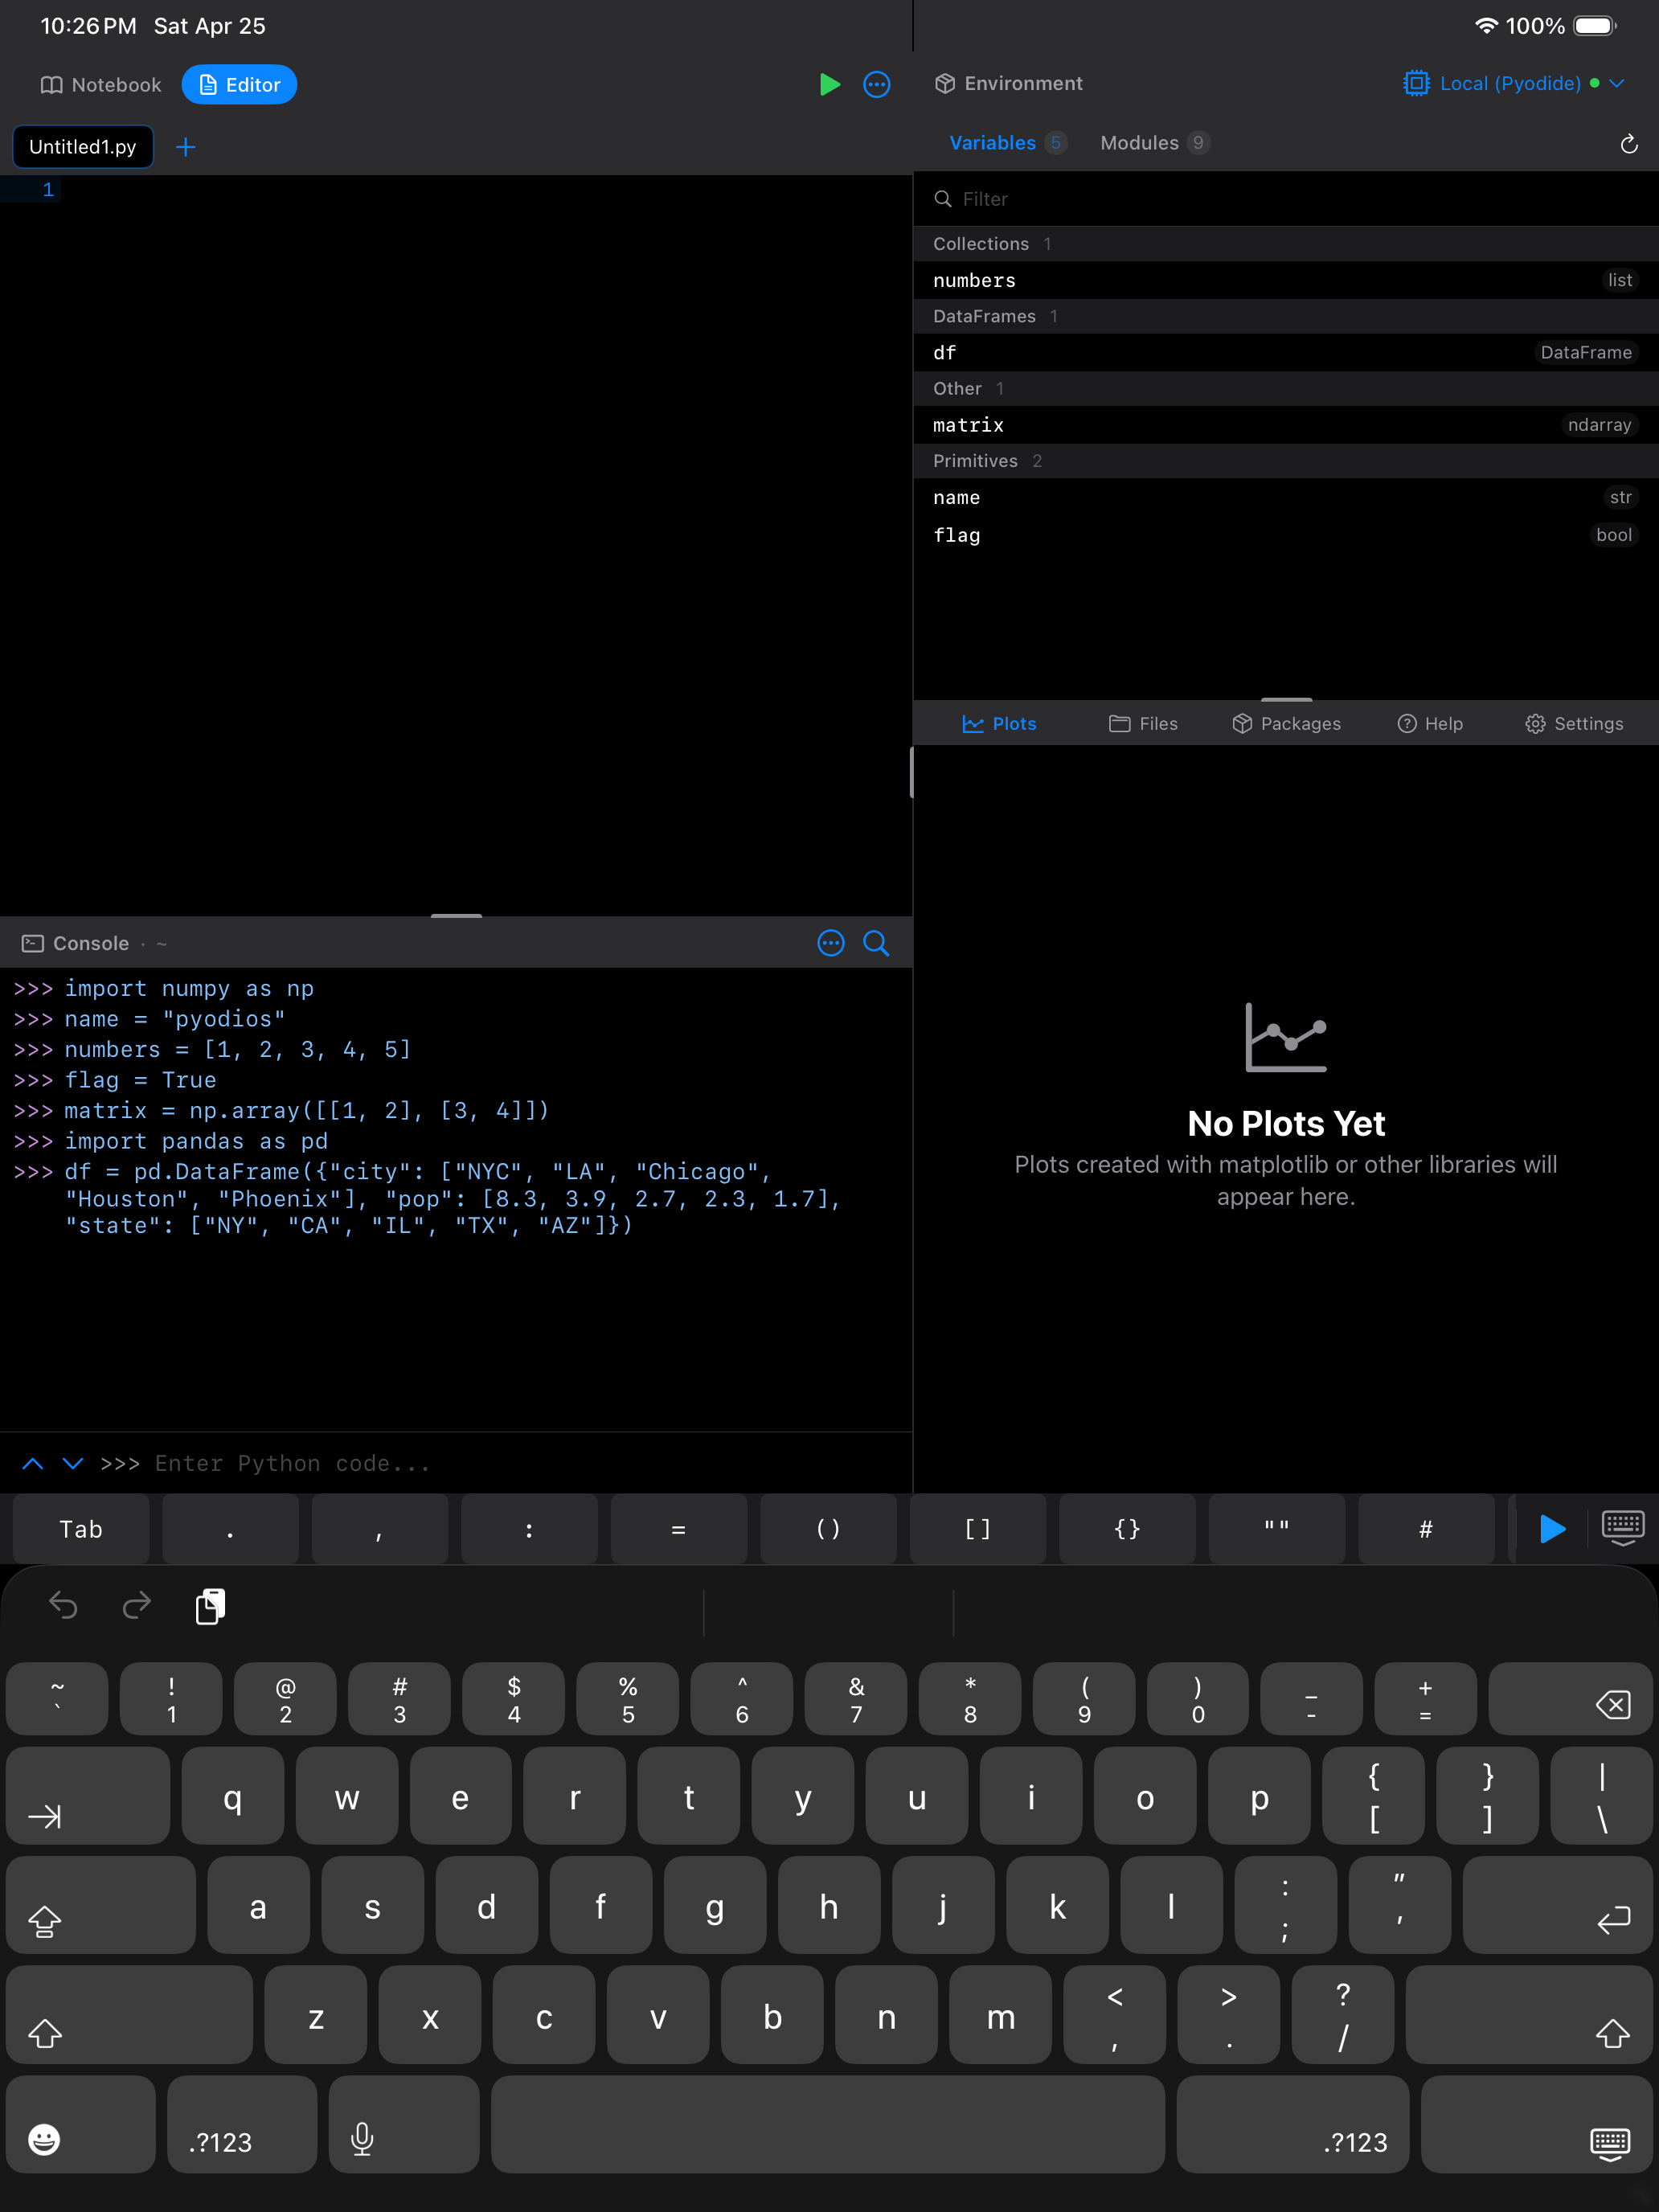
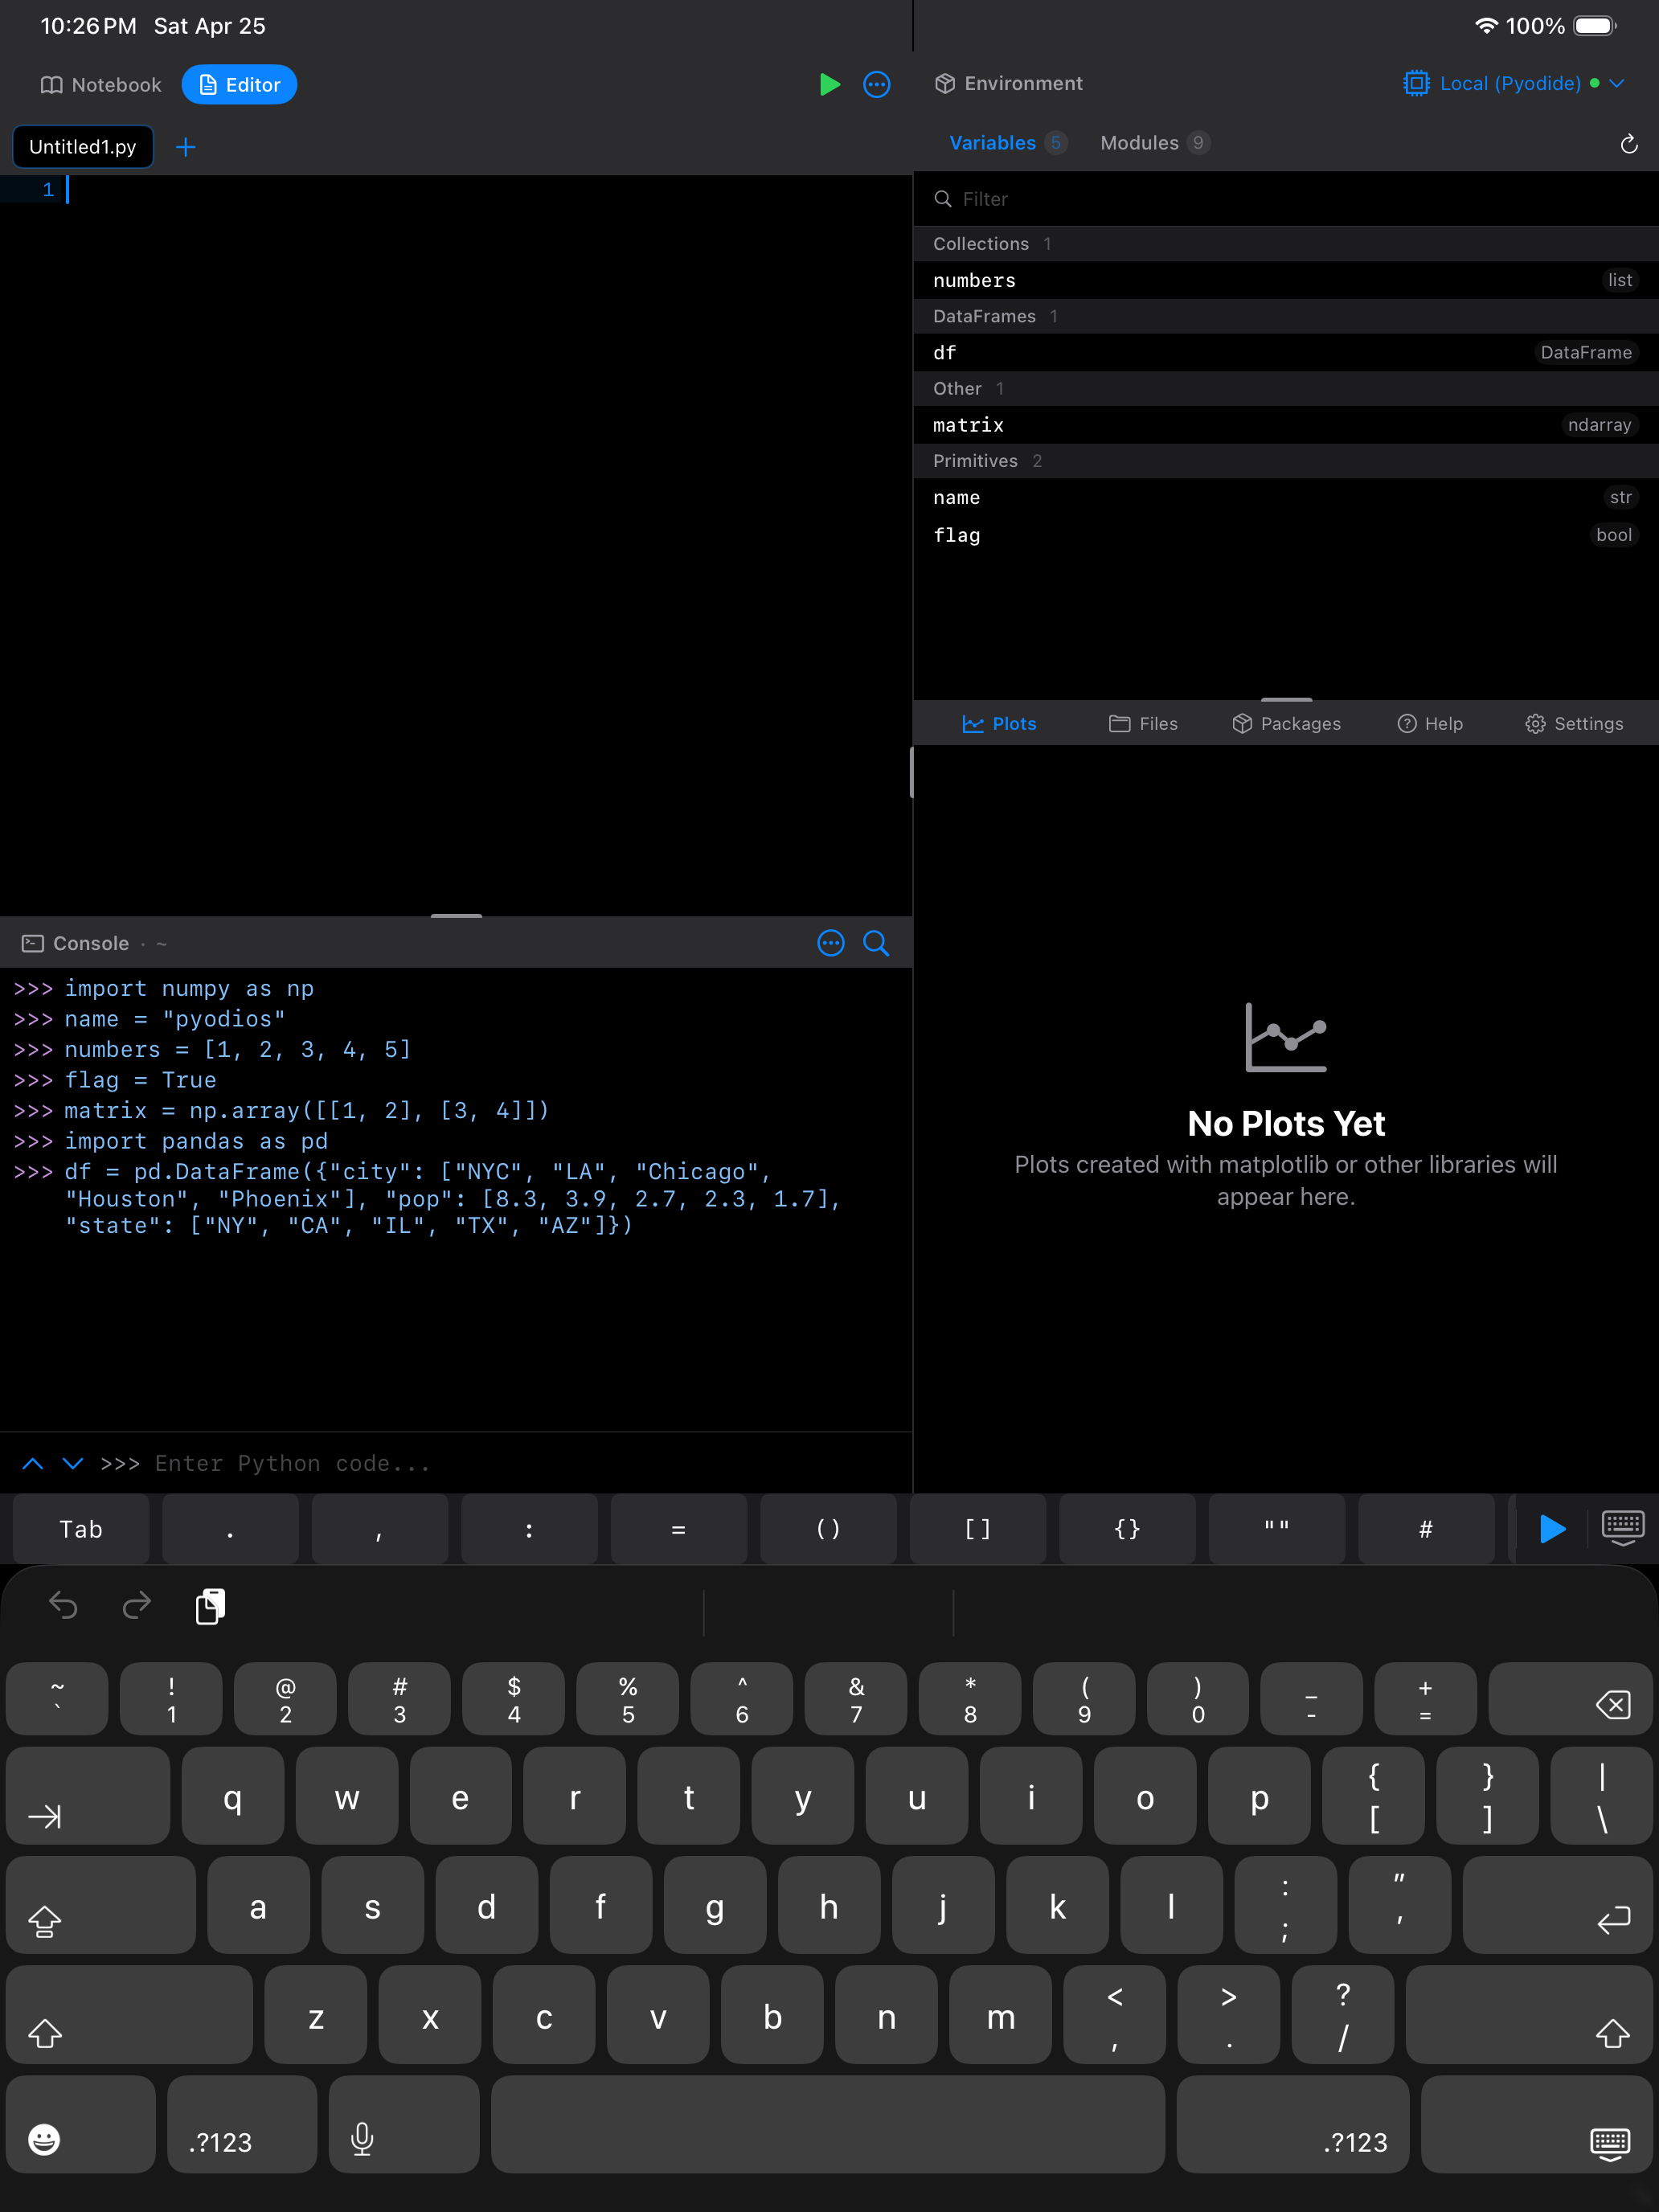
Once you start creating variables in the Notebook, Editor, or Console, they show up here automatically. The list refreshes after each code execution, so you will see new variables appear right after you create them.
Try running this in a notebook cell or the console:
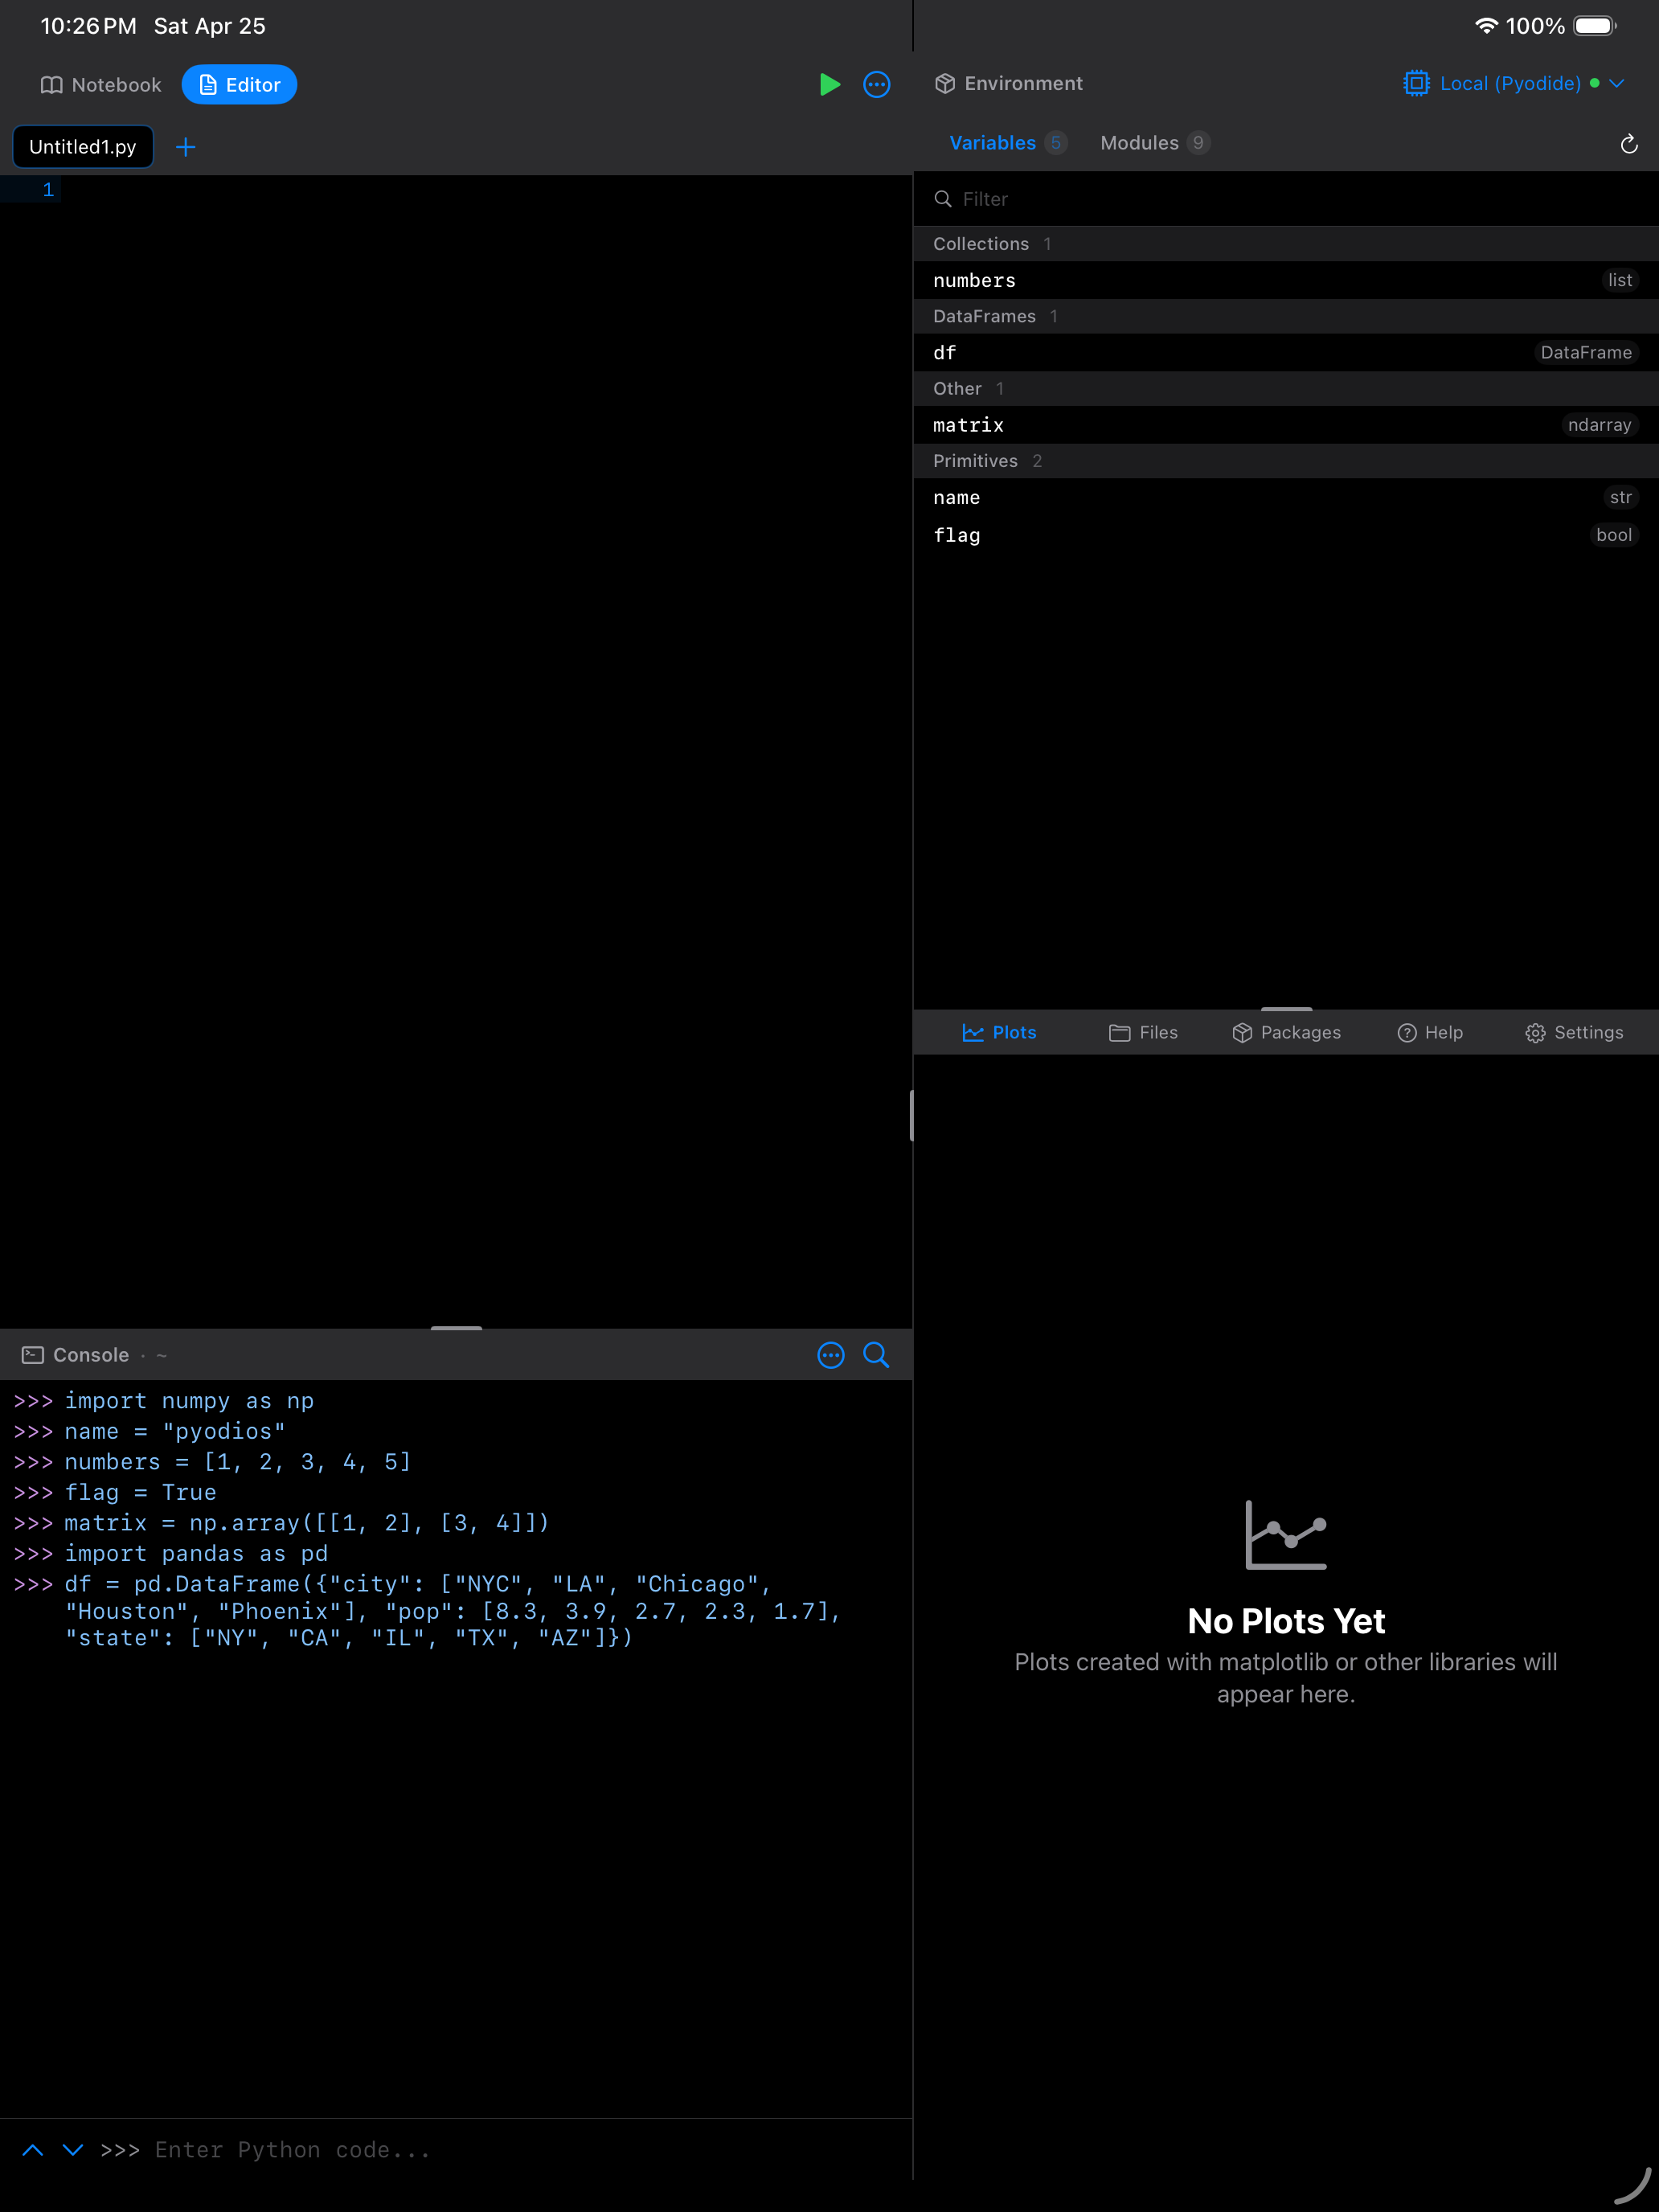
import numpy as np

name = "Pyodios"
numbers = [1, 2, 3, 4, 5]
matrix = np.array([[1, 2], [3, 4]])
data = {"a": 1, "b": 2, "c": 3}
After execution, all five variables appear in the Environment tab instantly.
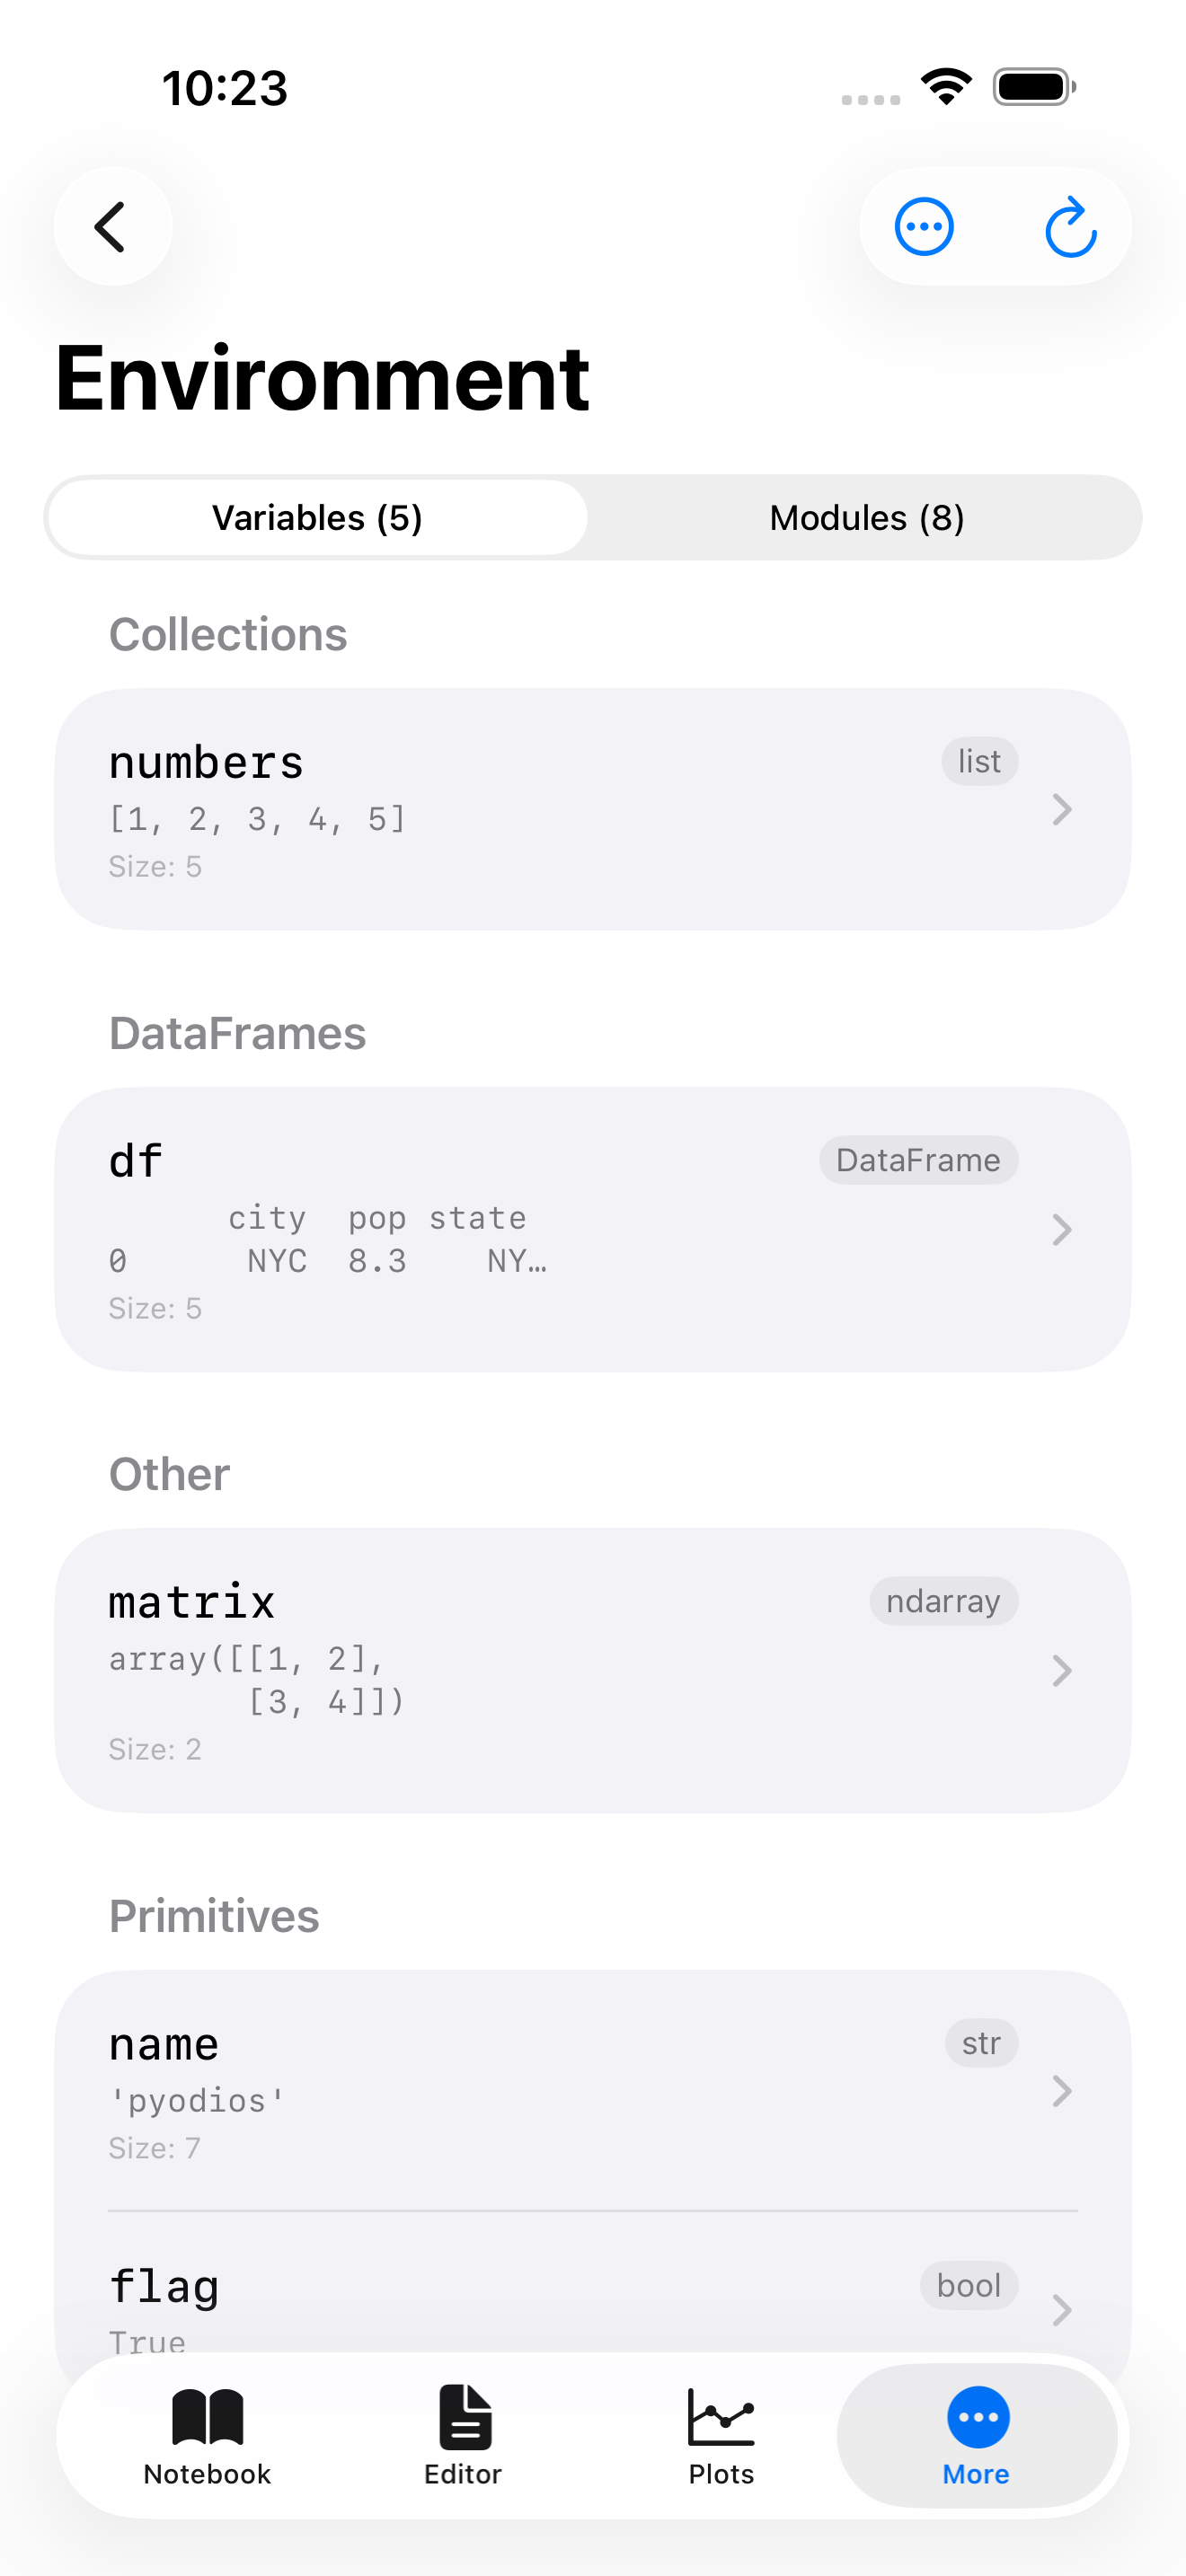


Each variable row shows you four things: the name you assigned it, the type (like list, dict, ndarray, or DataFrame), the estimated memory size it occupies, and a short preview of the first few values. That preview alone can save you a lot of typing. You can quickly confirm that numbers really does contain what you think it does without printing it.
How variables are organized
Your variables are automatically sorted into groups based on their Python type. This makes it easy to find what you are looking for, especially when your environment starts getting crowded:
- DataFrames:
pandas.DataFrameandpandas.Seriesobjects - Arrays:
numpy.ndarrayand similar array types - Collections:
list,dict,set, andtupleobjects - Functions: any functions or classes you have defined
- Modules: imported modules like
numpy,pandas,math - Values: everything else: strings, integers, floats, booleans, and other scalars
If you have added any variables to your watch list (more on that below), they appear at the very top in their own “Watched” section, regardless of type.
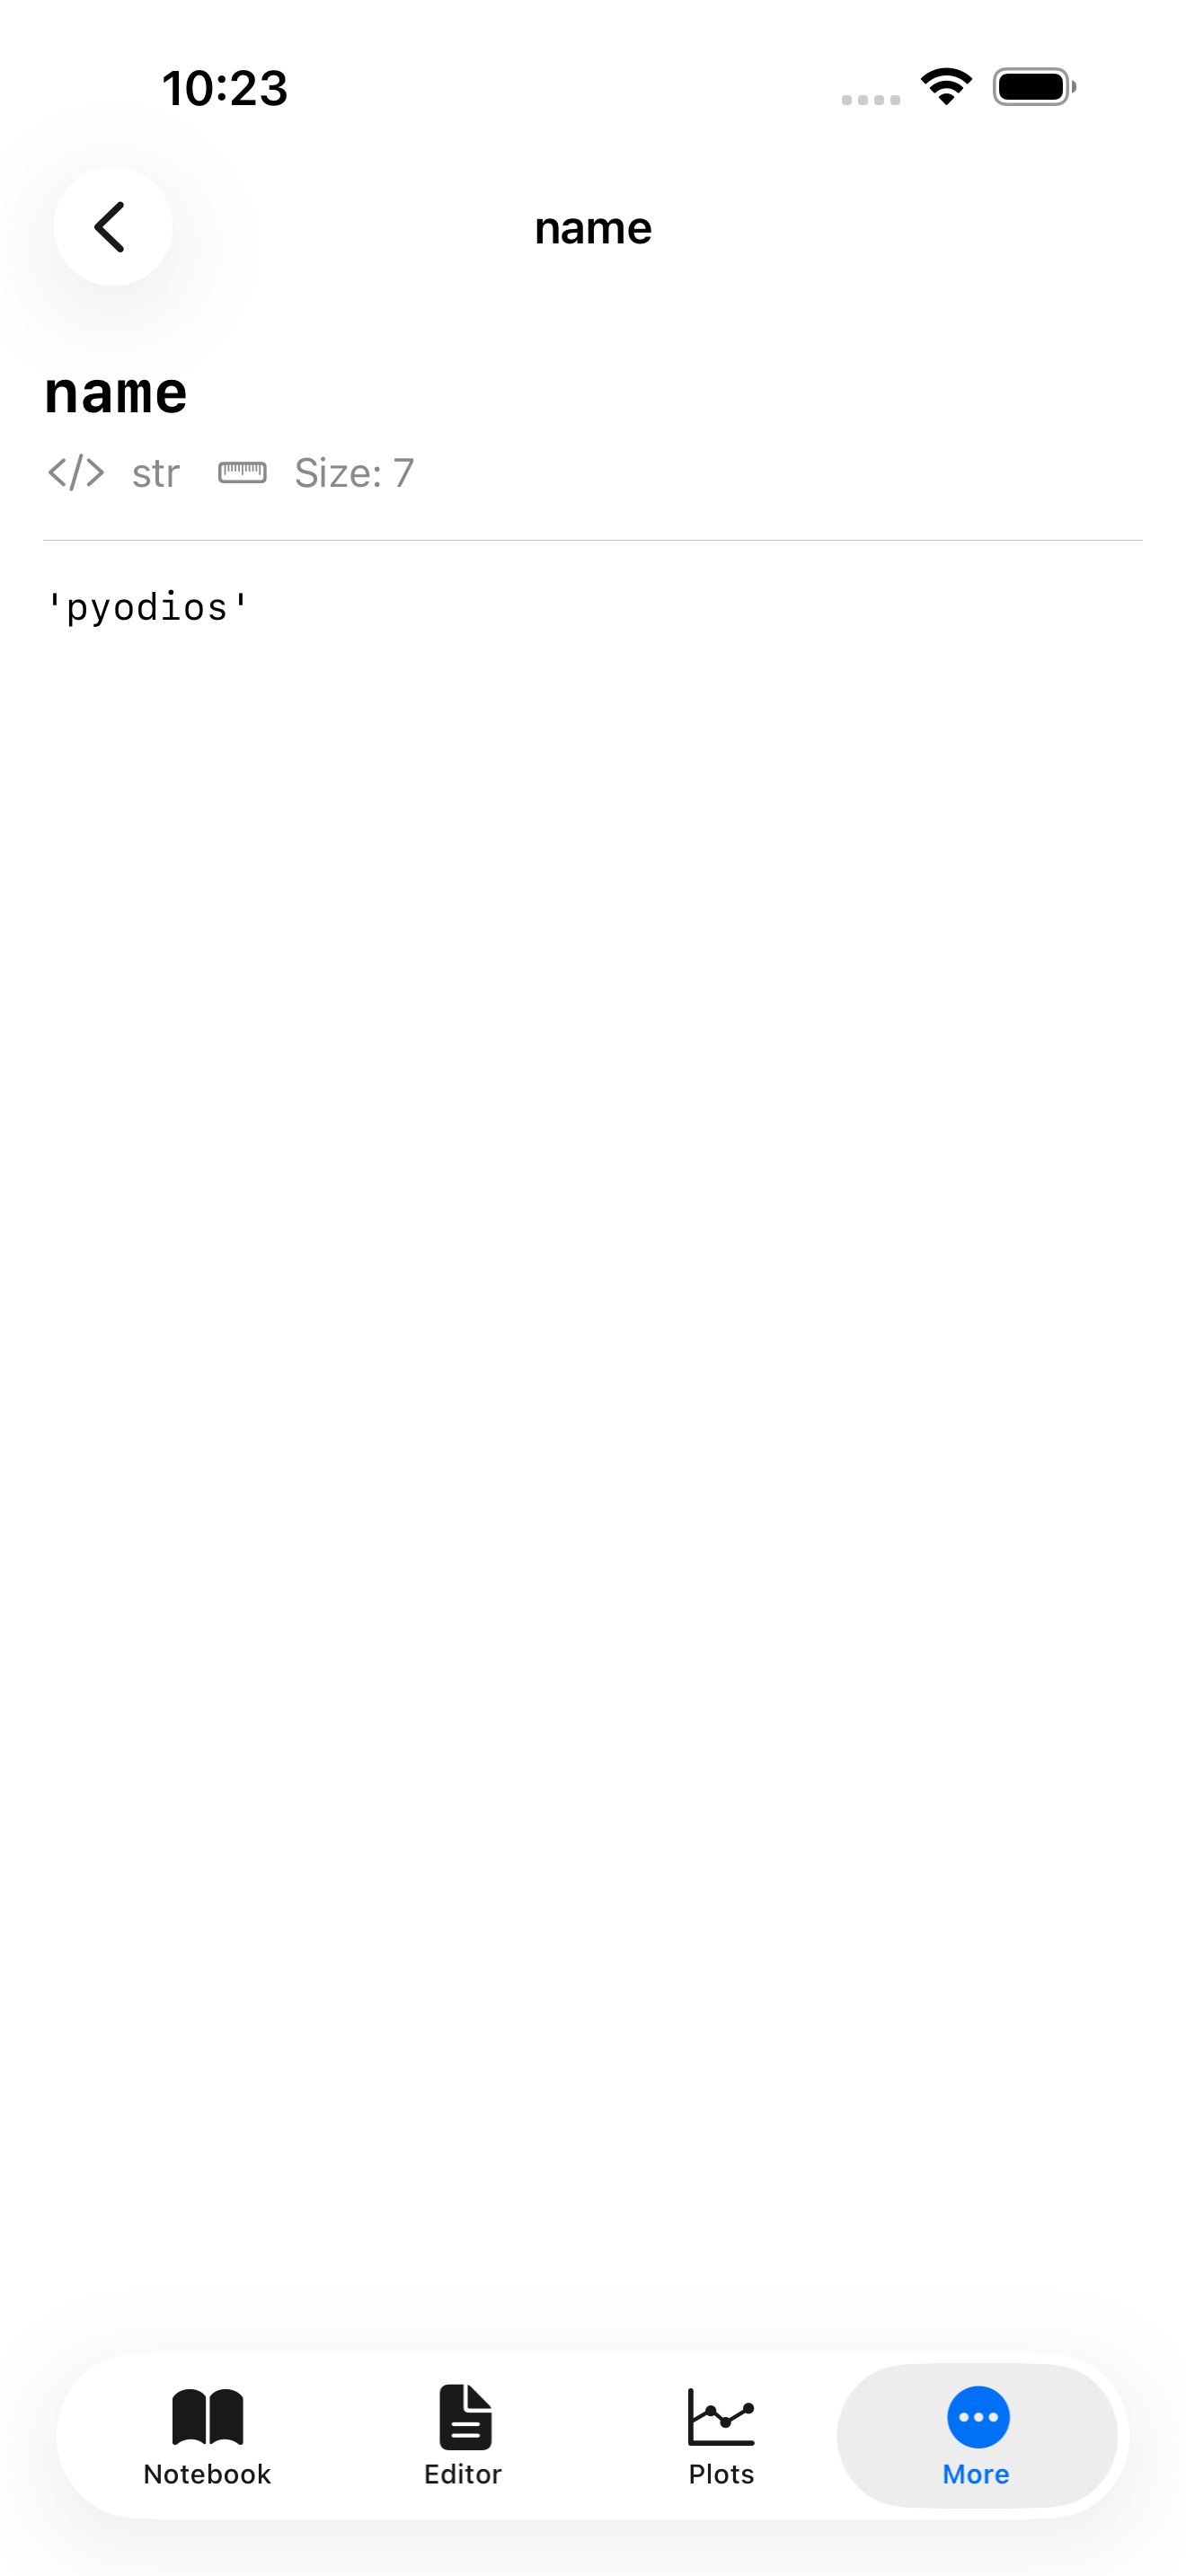
Inspecting a variable in detail
Tap any variable to open a detail sheet with much richer information than the list preview. What you see depends on the type:
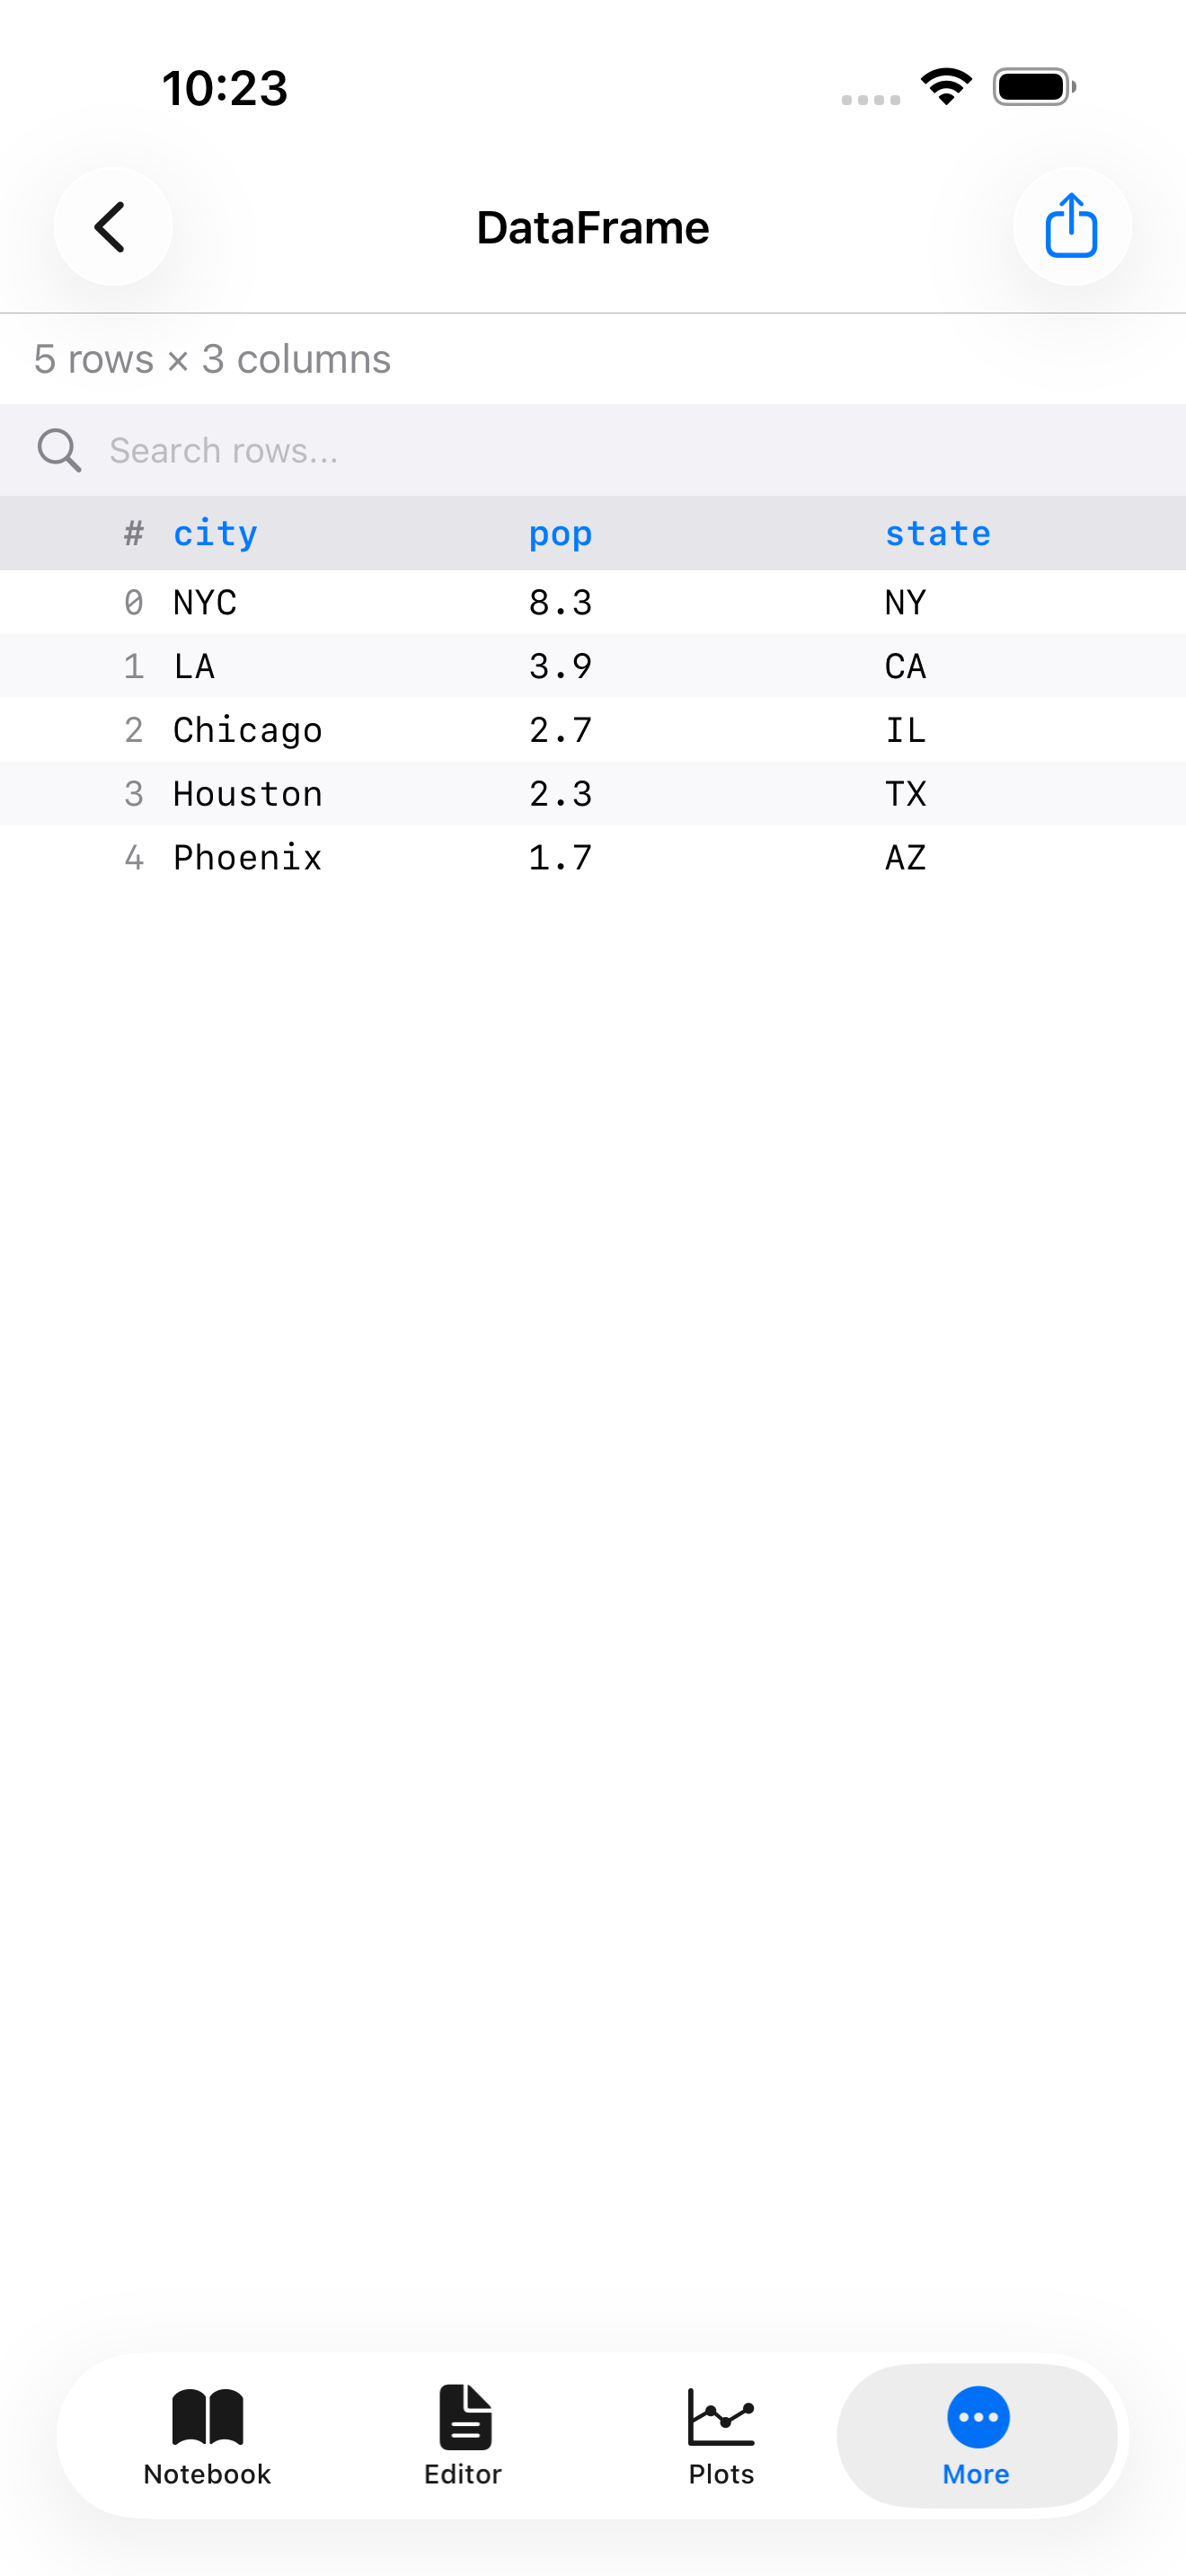
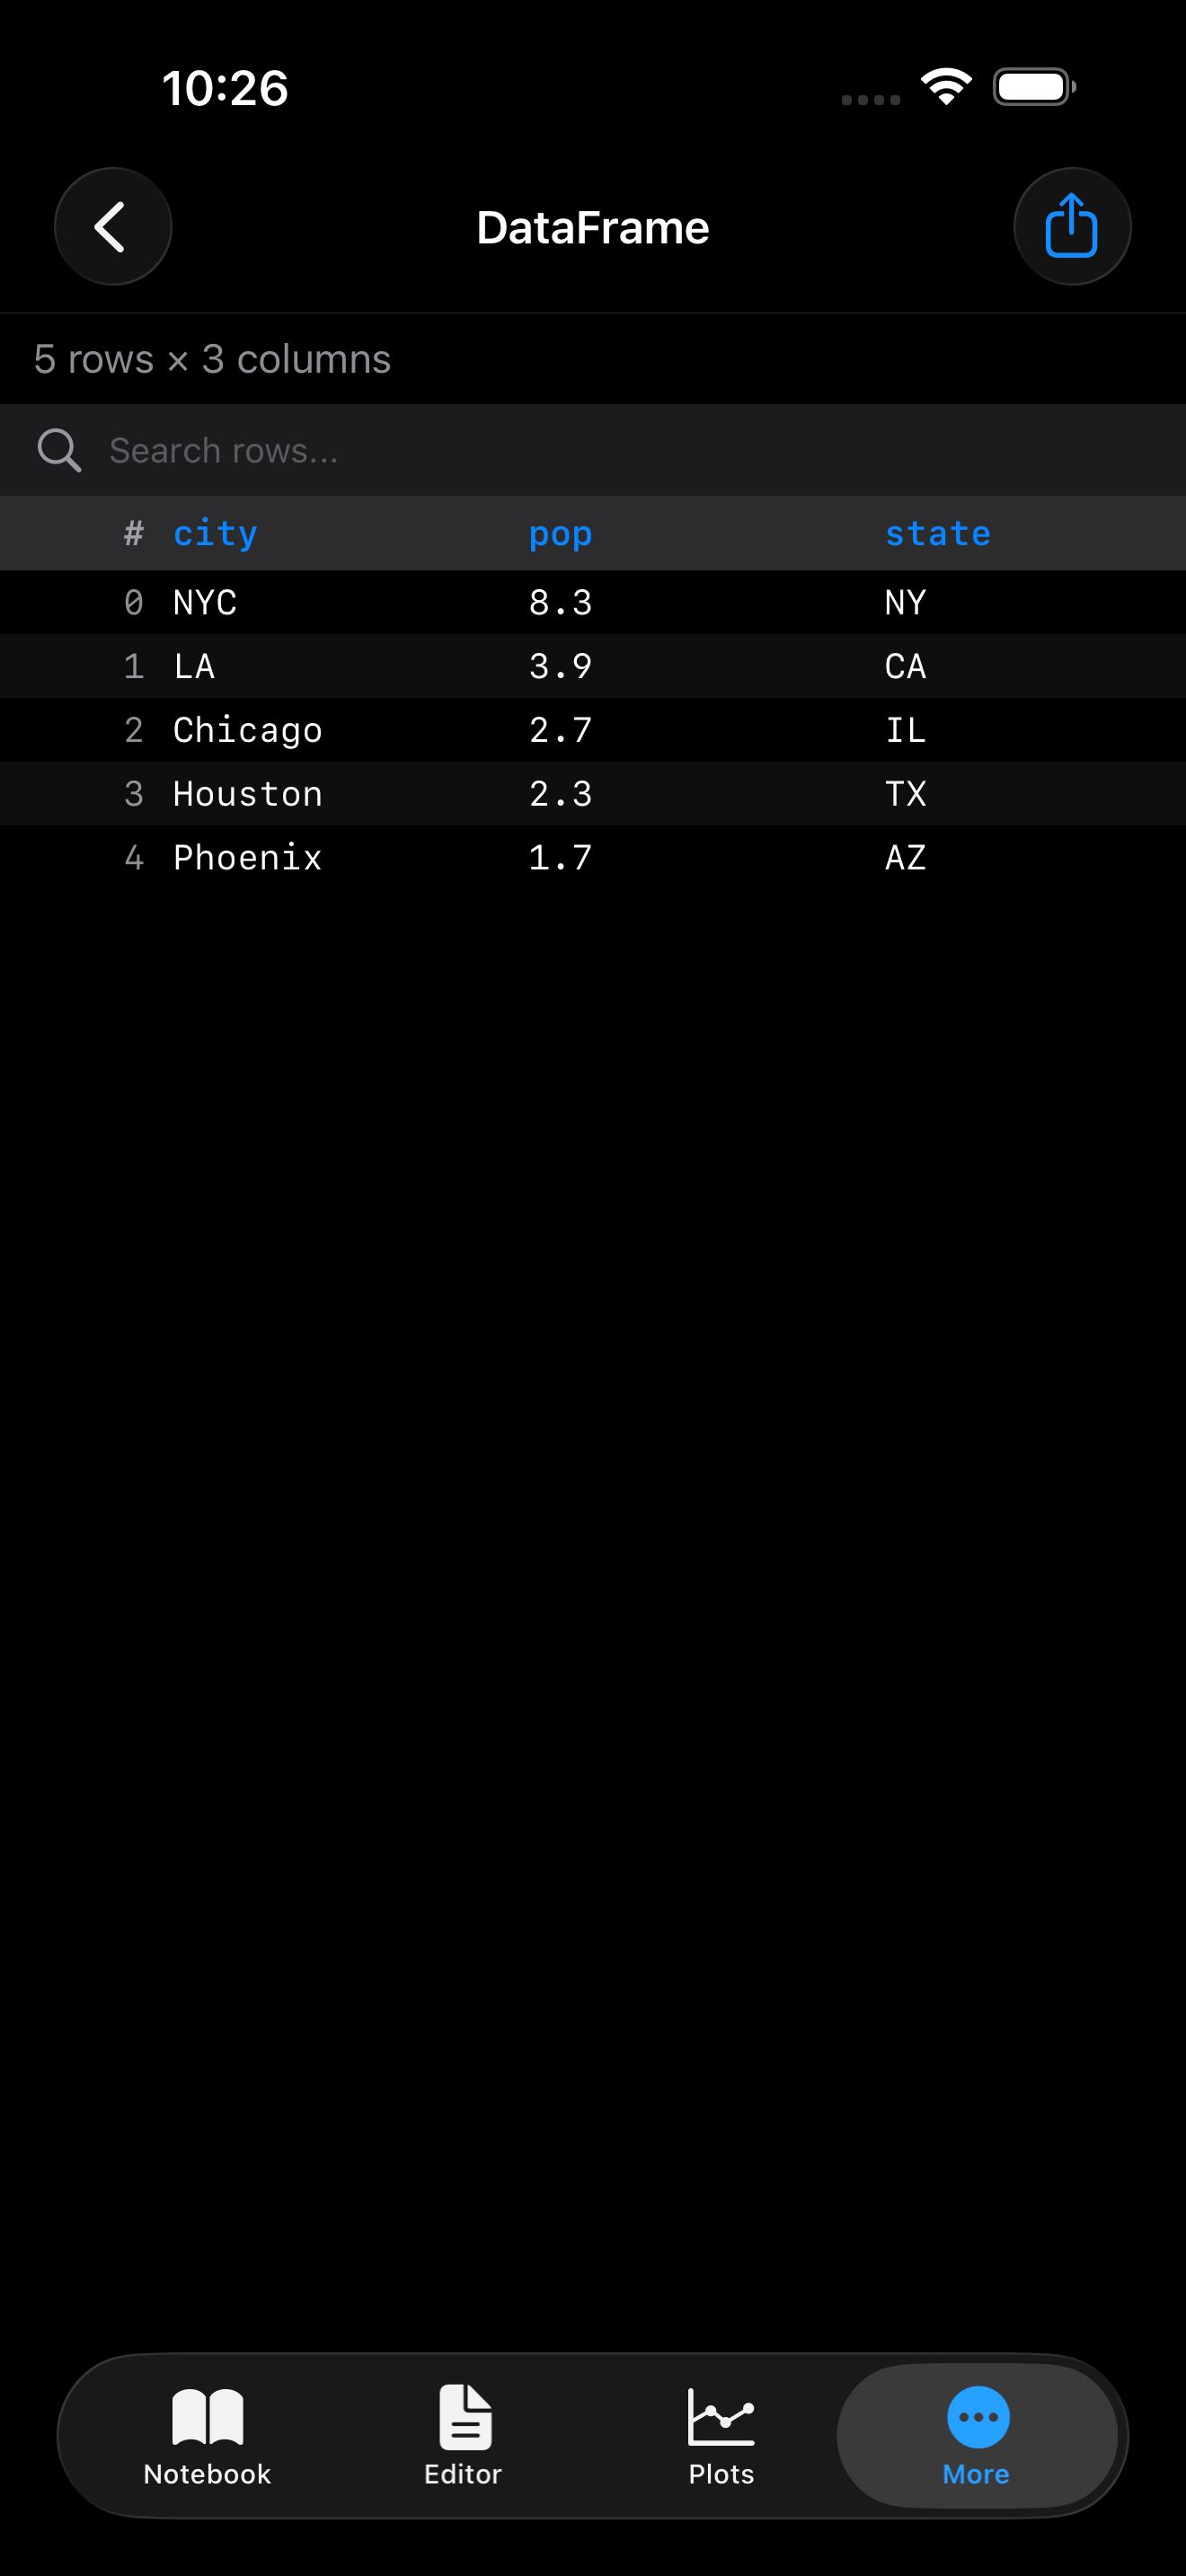
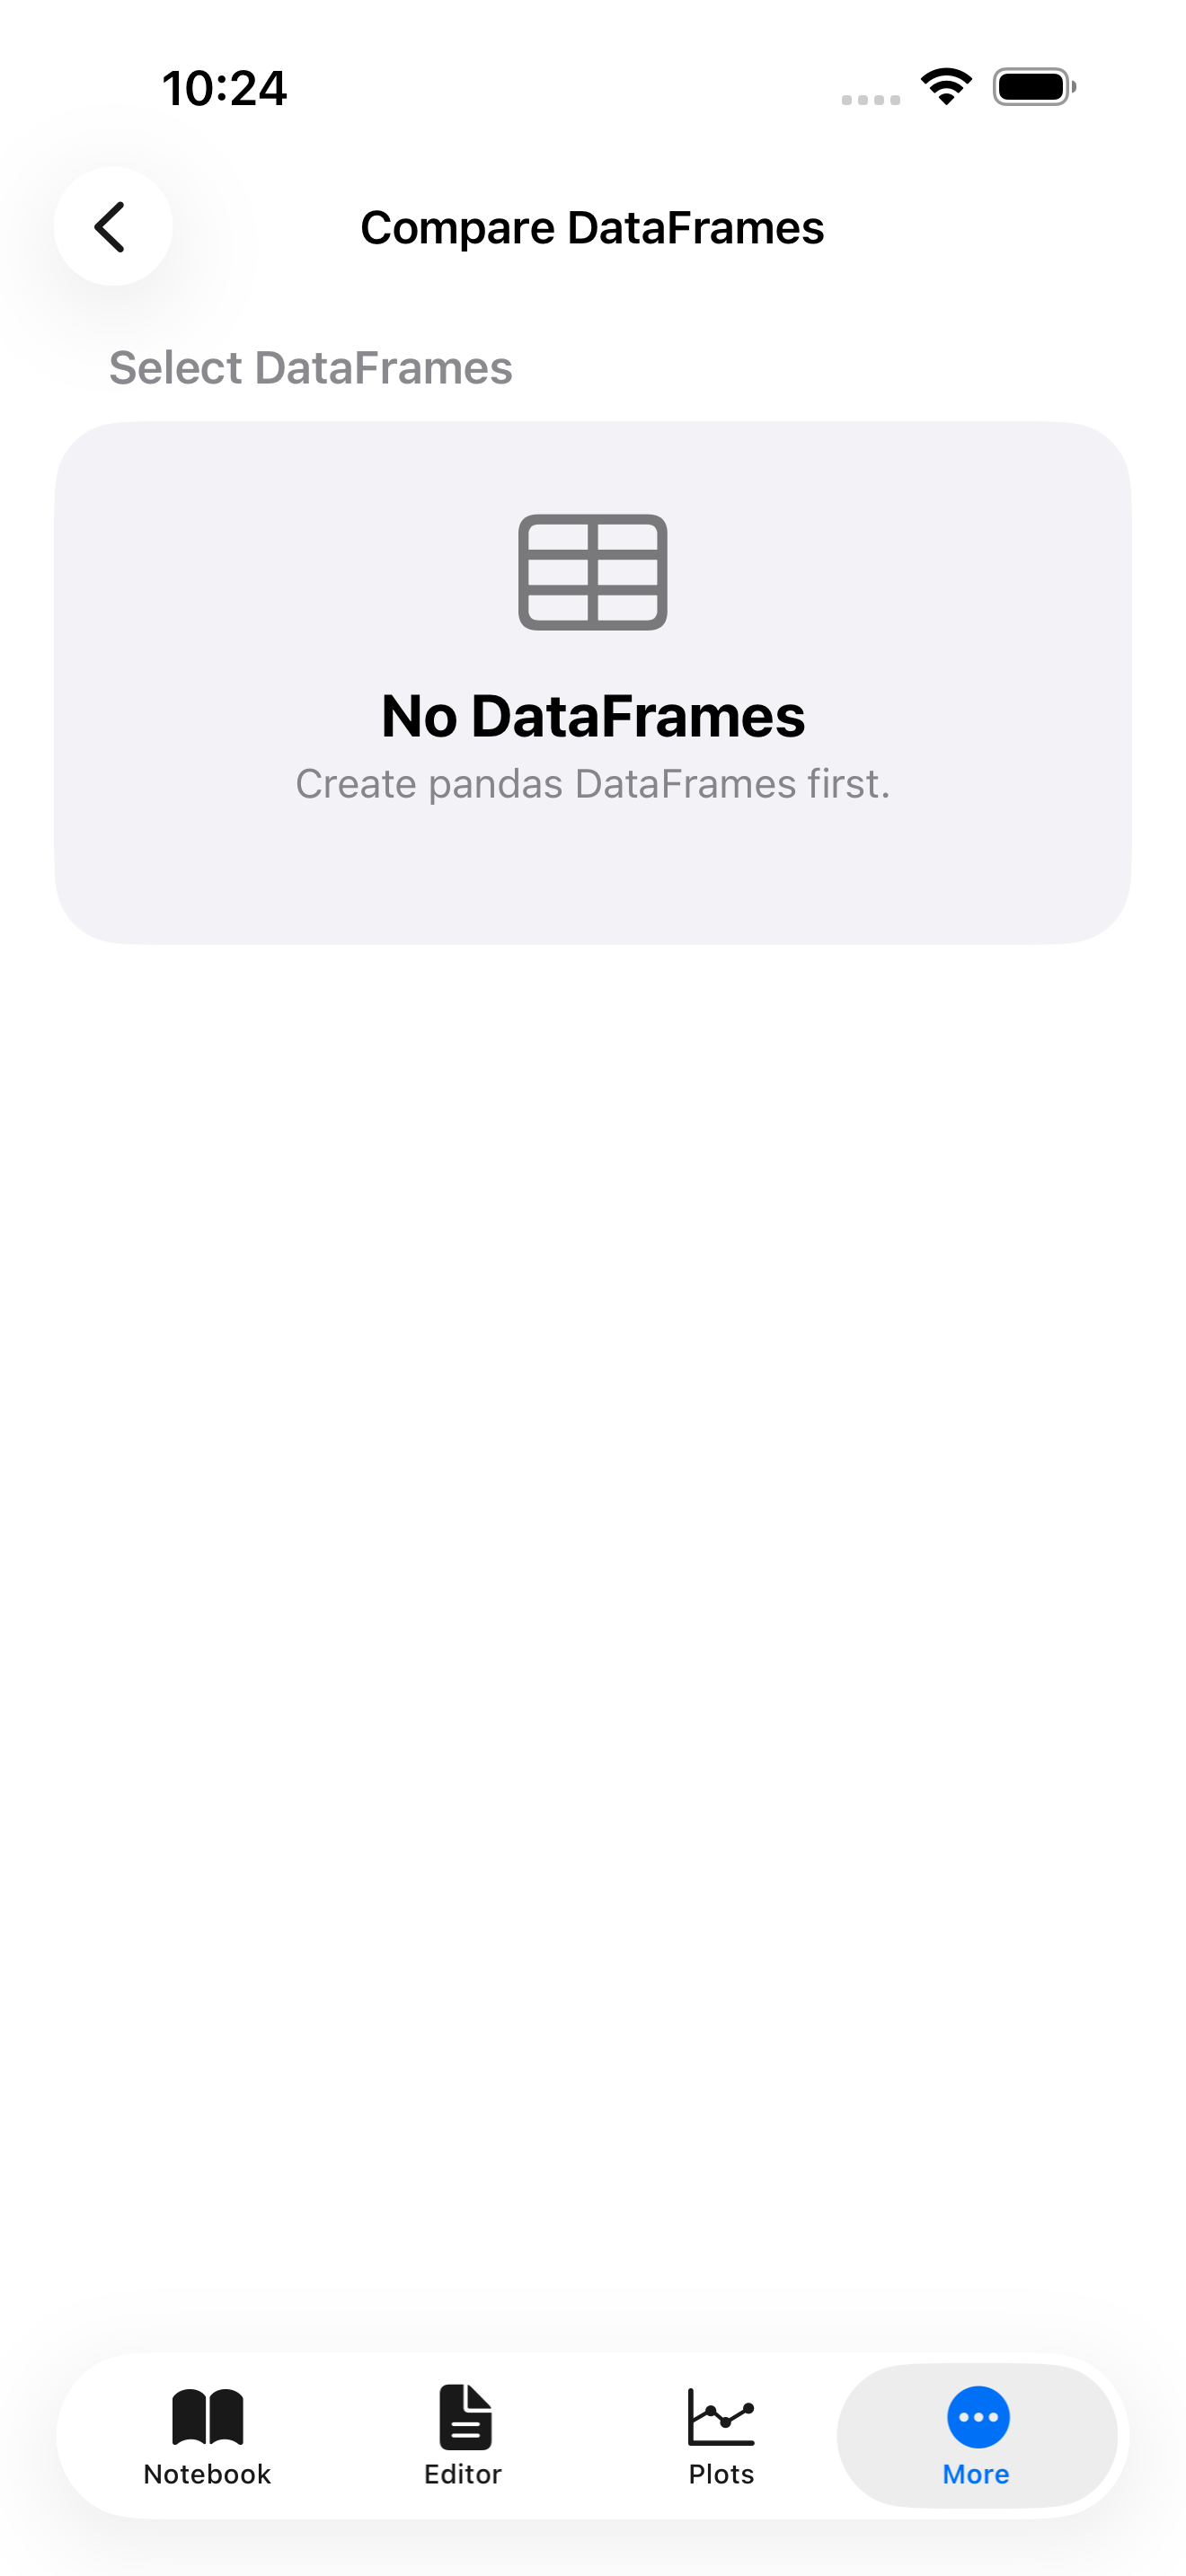
For DataFrames, you get a list of all columns with their dtypes and sample values, plus a text preview of the first rows. There is also an “Open in DataFrame Viewer” button that gives you a full scrollable table view with sortable columns, handy for exploring larger datasets.
For lists and tuples, you see the length, the type of each element, and a preview of the first 20 items.
For dicts, you see the keys and values with their types, along with a nested structure view for complex dictionaries.
For NumPy arrays, you see the shape, dtype, and a formatted preview of the array contents.
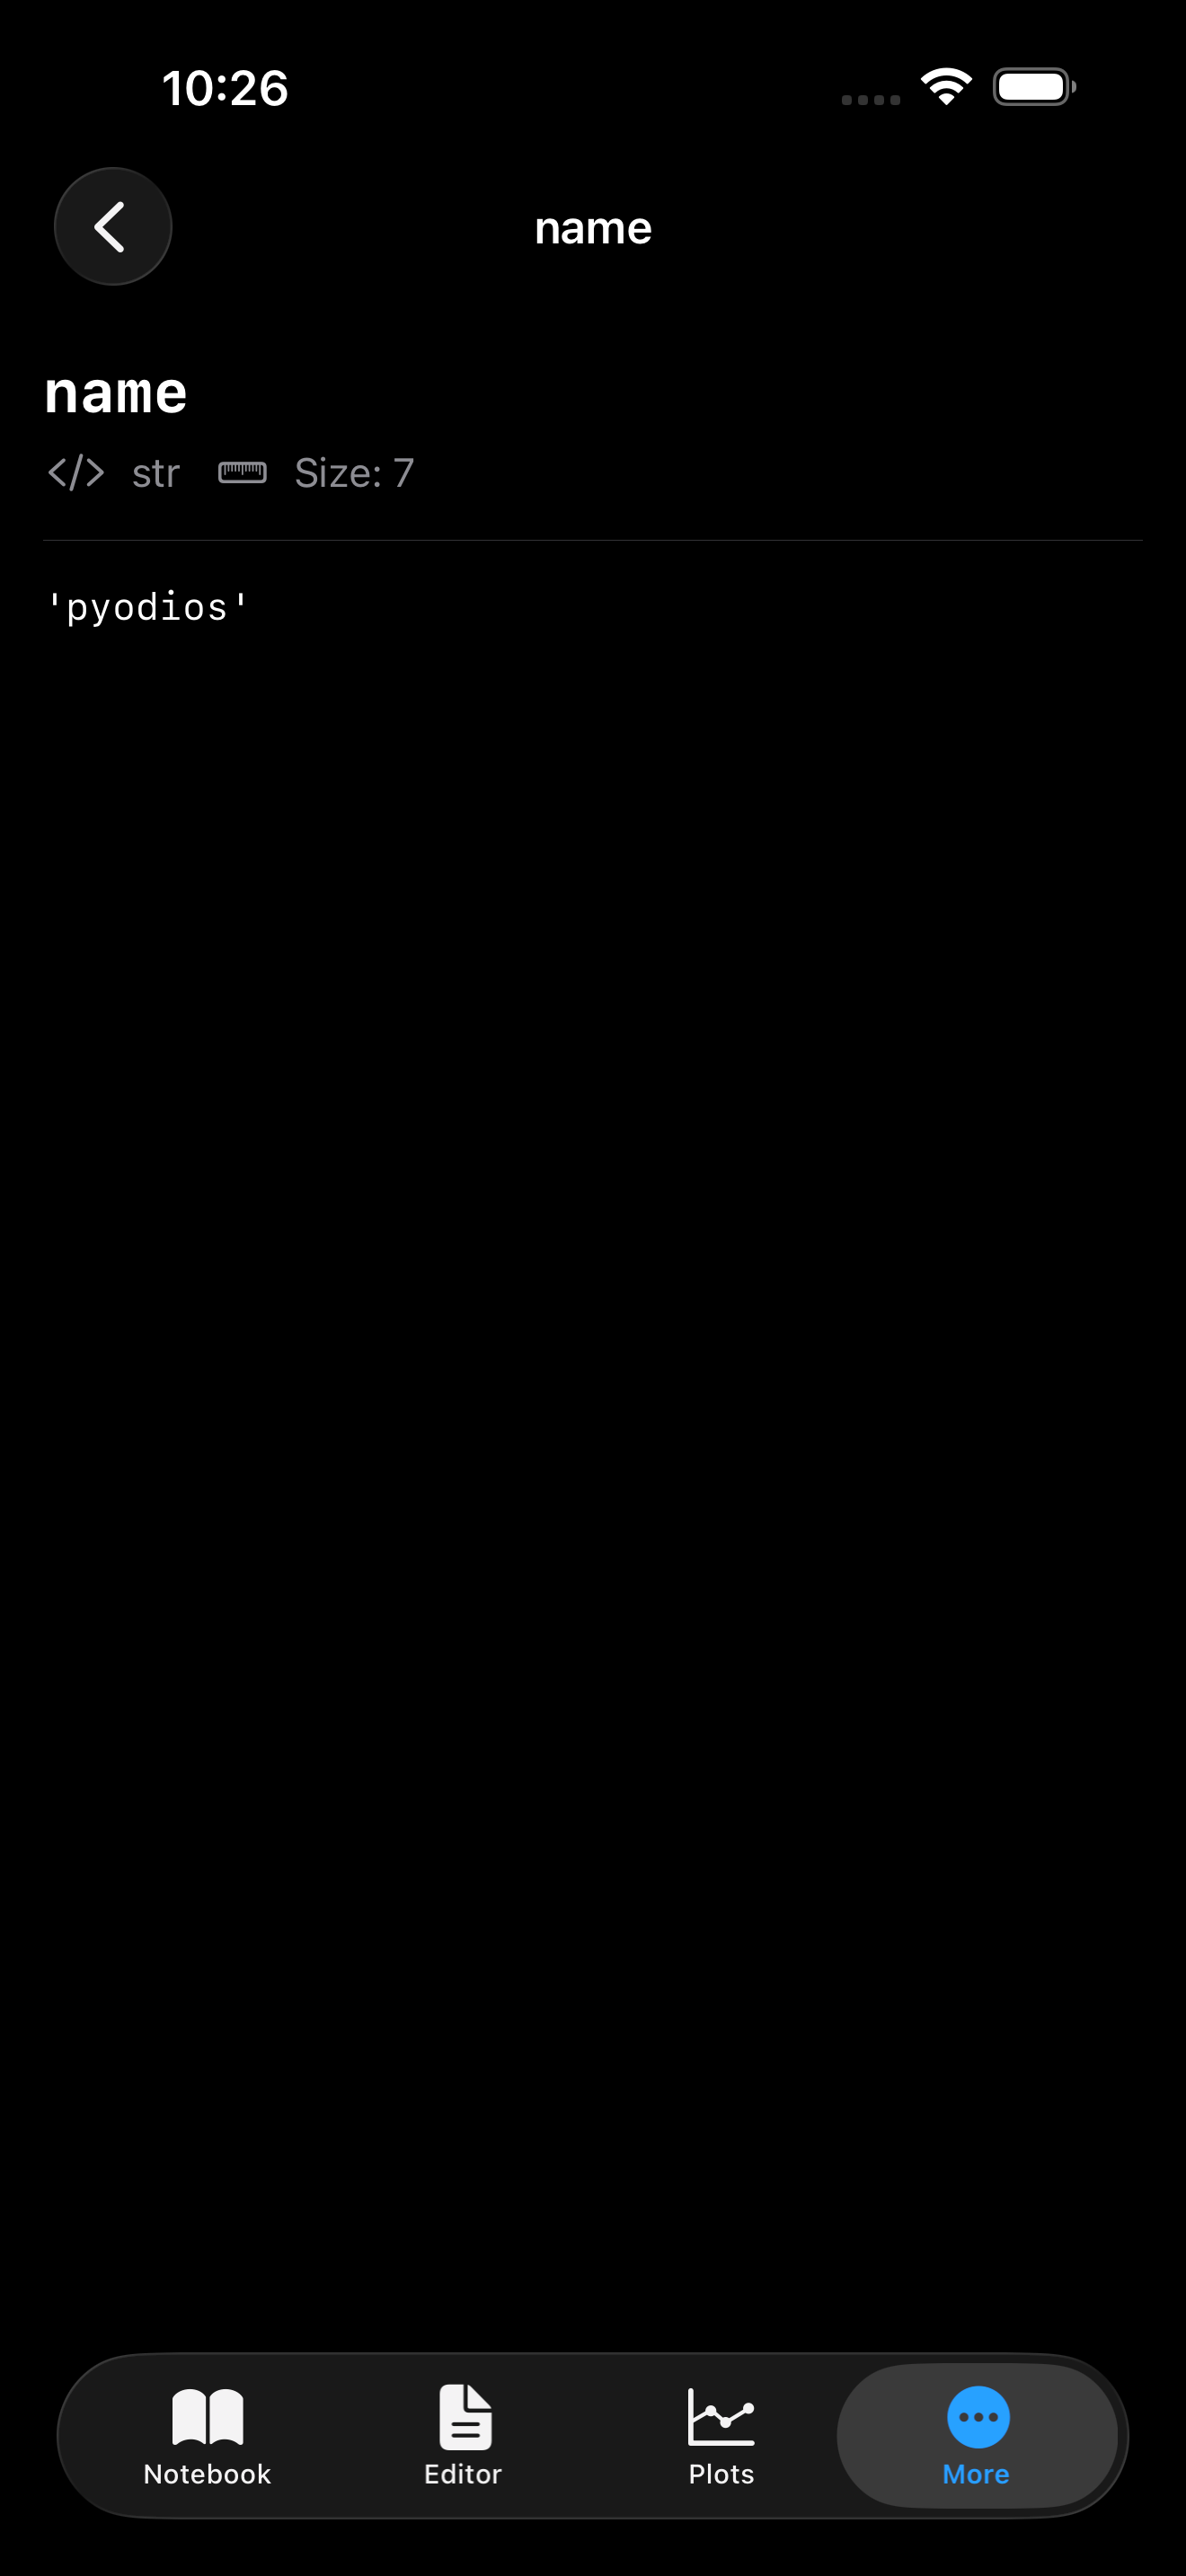
For scalars (strings, numbers, booleans), you see the full value with the complete repr() output.
Every detail view also includes a “Copy as Python Code” section that gives you the code needed to recreate that variable from scratch. This is useful for sharing data with someone or saving a snapshot.

DataFrame Viewer
When you open a DataFrame in the detail view, tap Open in DataFrame Viewer to see a full scrollable table. The viewer supports:
- Sortable columns: tap any column header to sort ascending or descending
- Column types: each header shows the dtype (int64, float64, object, etc.)
- Row indices: the DataFrame index is displayed in a fixed left column
- Large datasets: smooth scrolling through thousands of rows

Quick actions with long press
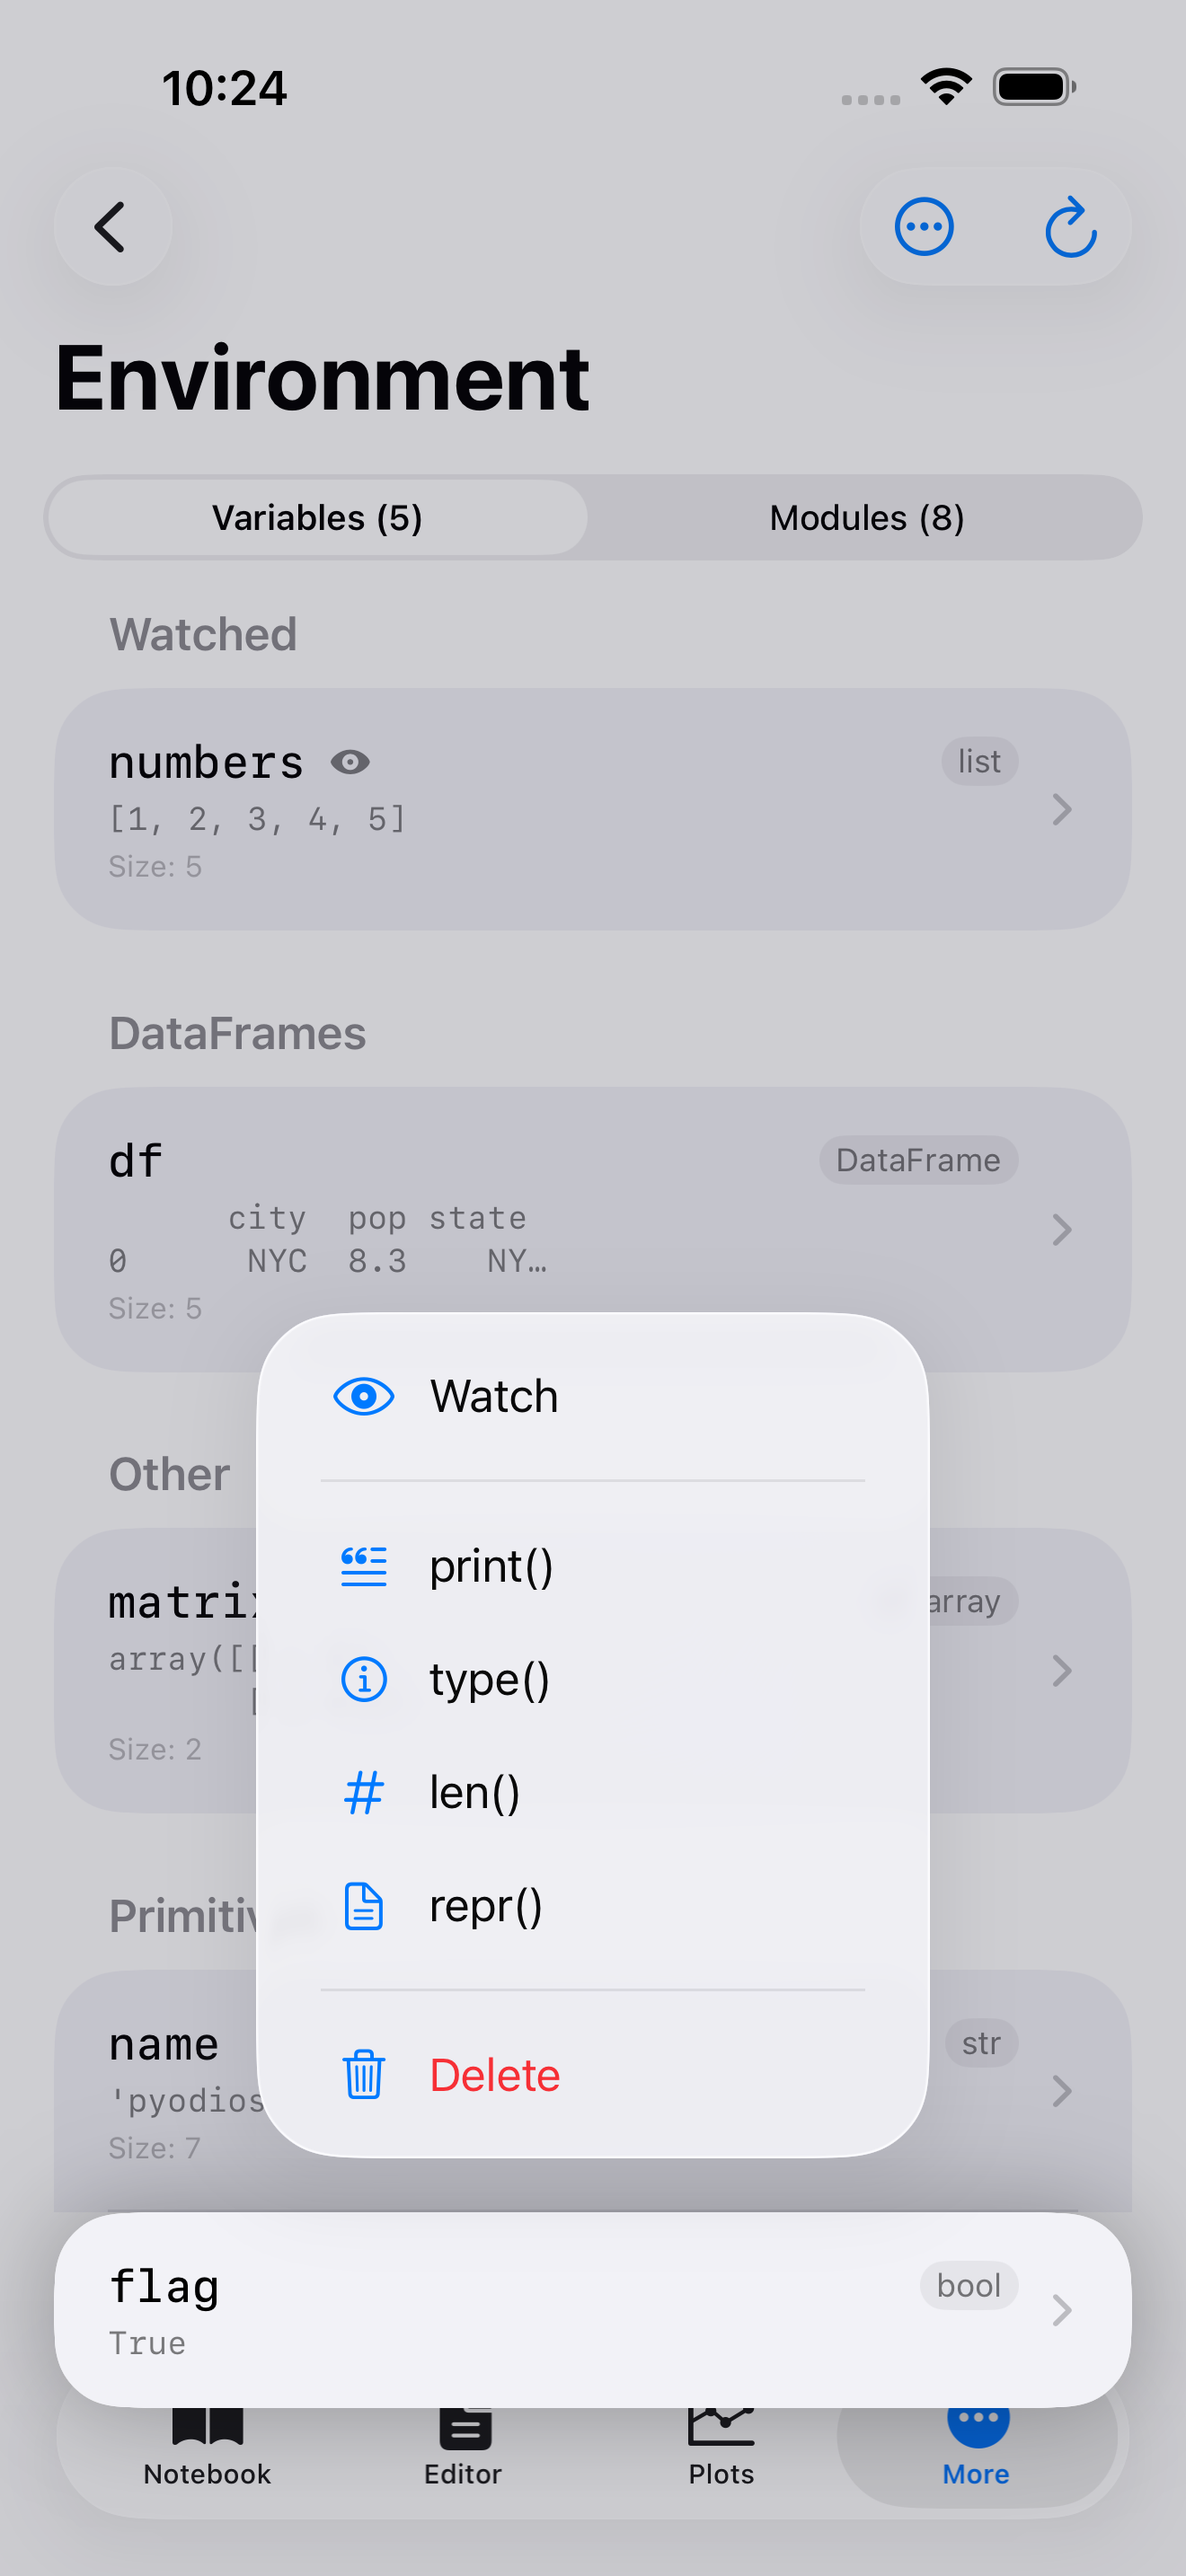
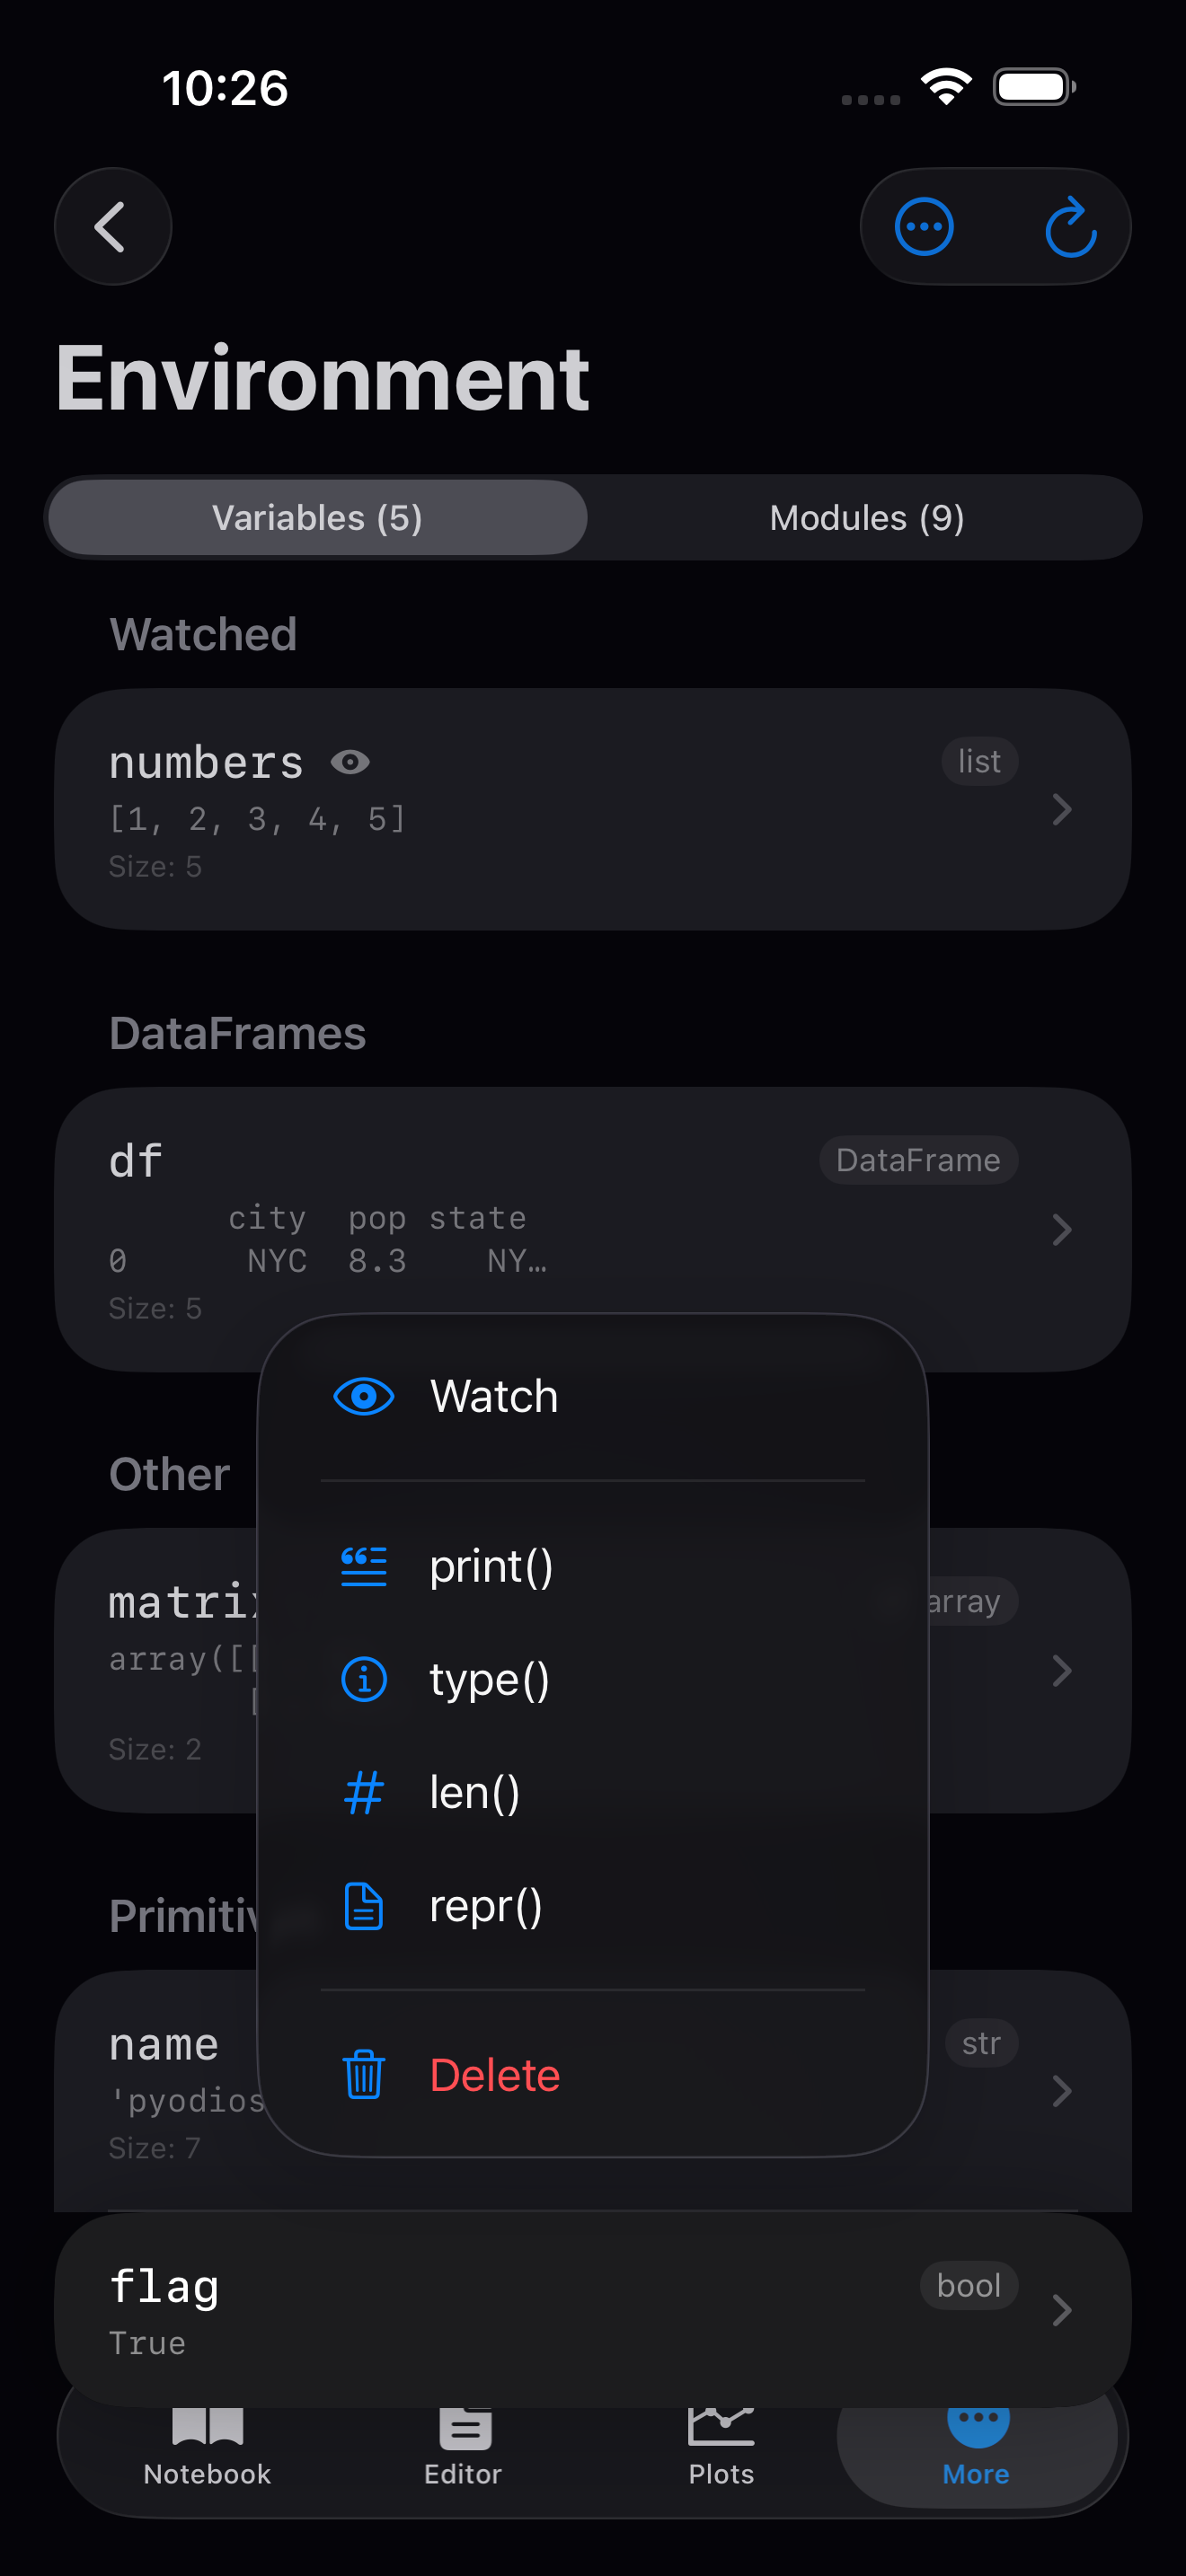
You do not always need the full detail sheet. Long-press (or right-click on iPad) on any variable to get a context menu of quick actions:
- print(): runs
print()and shows the result in a popup - type(): shows the type of the variable
- len(): shows the length (for sequences, dicts, and other sized objects)
- repr(): displays the
repr()output for a precise representation
These quick actions save you from switching to the Console just to run a one-off inspection command.
Variable diff
Want to see what changed between executions? The Environment tab tracks variable snapshots and can show you a diff of what was added, removed, or modified after each code run. Variables that changed since the last execution are highlighted with a subtle indicator, making it easy to see the effect of your code at a glance.
Open the diff view from the ... menu in the Environment toolbar and choose Compare Snapshots.

Watching variables
If there are certain variables you want to keep an eye on (maybe a running total or a DataFrame you are building up incrementally), you can add them to your watch list. Watched variables are always pinned to the top of the Environment list so you can find them instantly.
To watch a variable, swipe right on it and tap Watch. You will see a small star badge appear next to the name. To stop watching, swipe right again and tap Unwatch, or use the long-press menu.
You can clear the entire watch list at once from the menu (the ... button in the toolbar).


Deleting variables
To remove a variable from the Python environment, swipe left on it and tap Delete. This runs del behind the scenes, so the variable is gone from memory immediately.
If you want to start fresh, tap the menu button (...) and choose Clear Environment. This removes all user-defined variables from the global namespace. You will get a confirmation prompt first, since this cannot be undone. Imported modules and built-in names are preserved.
When does the environment update?
The Environment tab refreshes automatically after each code execution in the Notebook, Editor, or Console. If you ever think the display is out of sync, pull down on the variable list to manually refresh, or tap Refresh from the menu.
The Environment tab is read-only. It shows what Python is holding in memory but does not let you edit values directly. To change a variable, run the assignment in the Console or a notebook cell.